


 372 / 762

372
Chapter 9: The Normal Probability Distribution
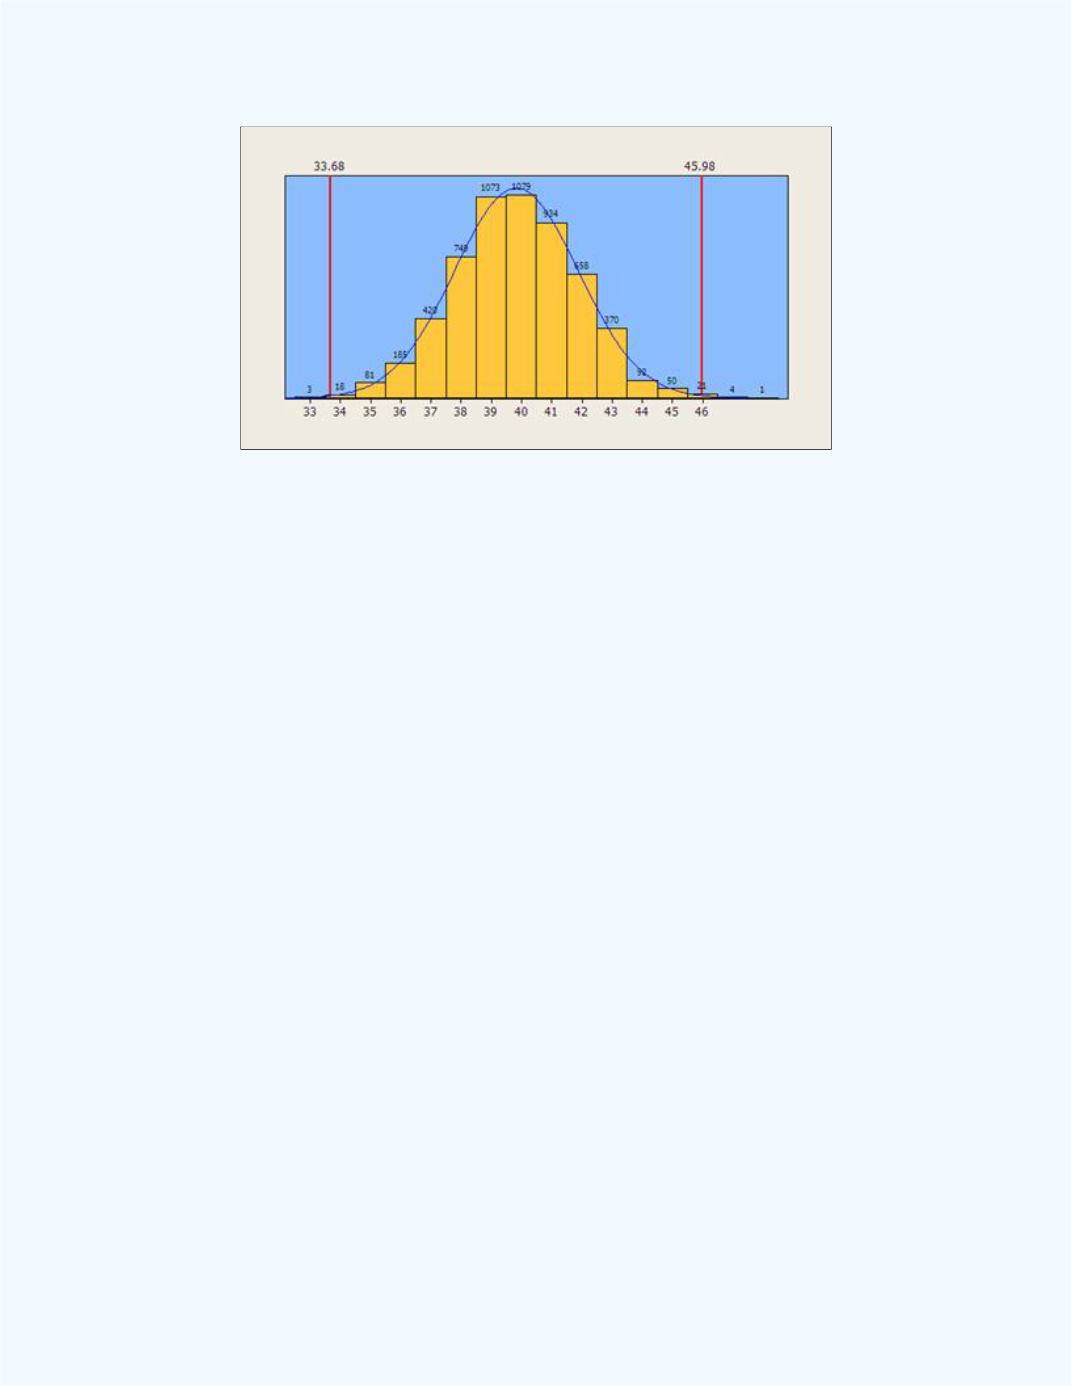
Figure 9-13:
Range of values to be included for the
Three-sigma rule for the Chest Size data
in
Illustration 3
The computed relative frequencies (probabilities) to be included in the
computations for
Illustration 3
are displayed in
Figure 9-14
.