


 367 / 762

Chapter 9: The Normal Probability Distribution
367
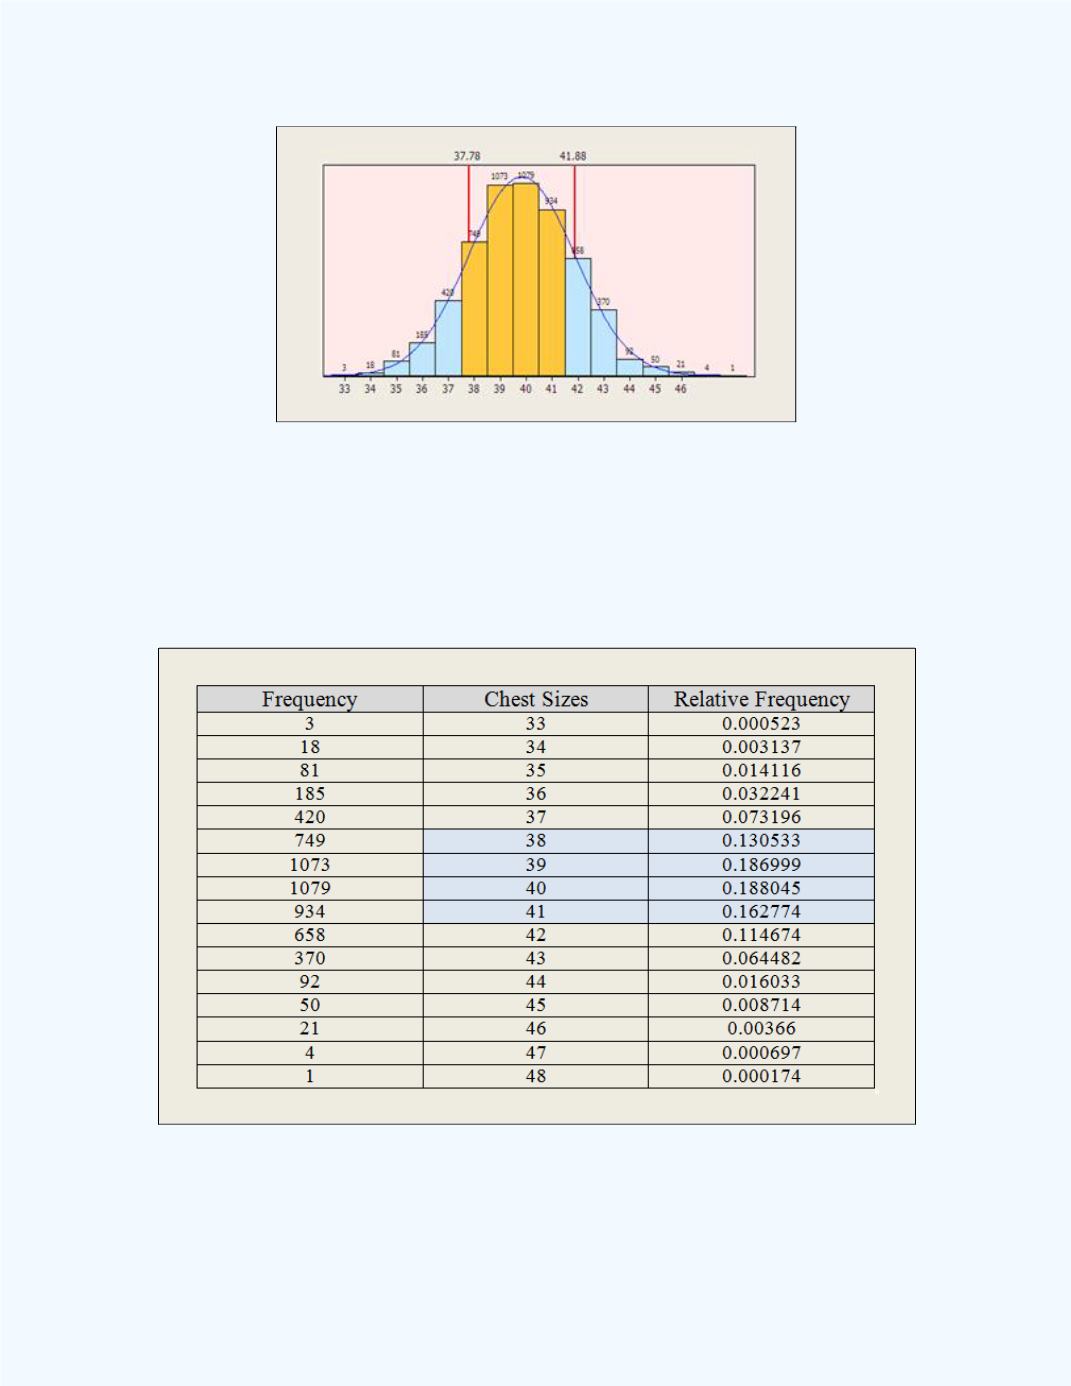
Figure 9-7:
Range of values to be included for the
One-sigma rule for the Chest Size data
in
Illustration 1
The computed relative frequencies (probabilities) to be included in the
computations for
Illustration 1
are displayed in
Figure 9-8
.
Figure 9-8:
Computed probabilities
to be included for the
One-sigma rule for the Chest Size data