


 369 / 762

Chapter 9: The Normal Probability Distribution
369
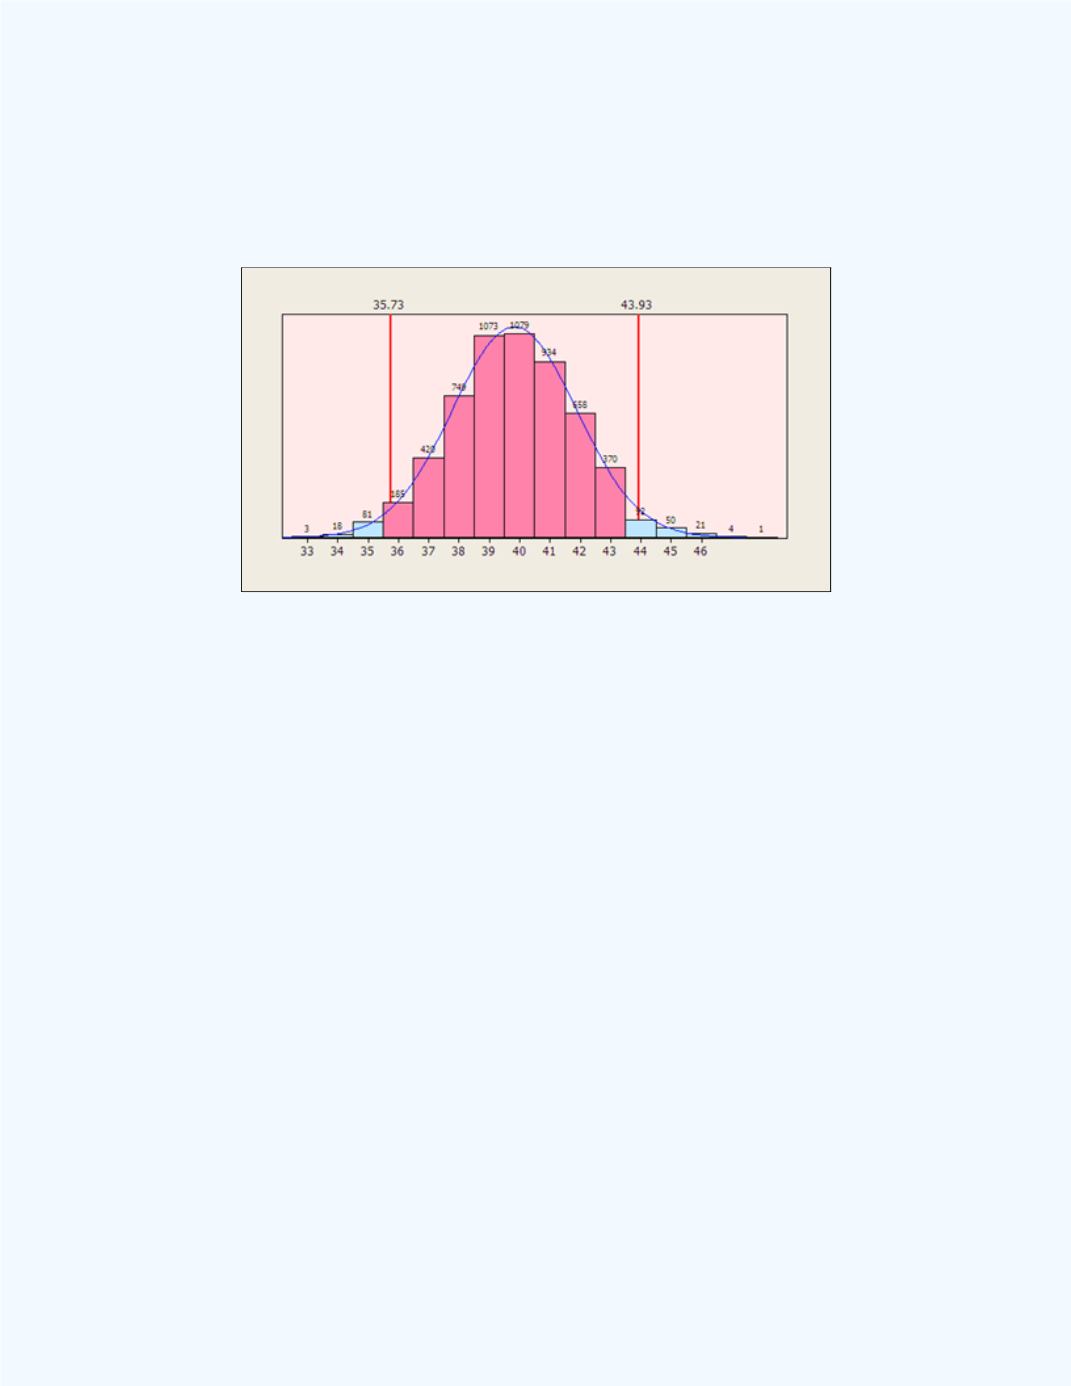
corresponding relative frequencies is approximately 0.952944. Refer to
Figure 9-11
for the computed probabilities. That is, approximately 95.3%
(close to 95%) of the values lie within two standard deviations from the
mean.
Figure 9-10:
Range of values to be included for the
Two-sigma rule for the Chest Size data
in
Illustration 2
The computed relative frequencies (probabilities) to be included in the
computations for
Illustration 2
are displayed in
Figure 9-11
.