


 361 / 762

Chapter 9: The Normal Probability Distribution
361
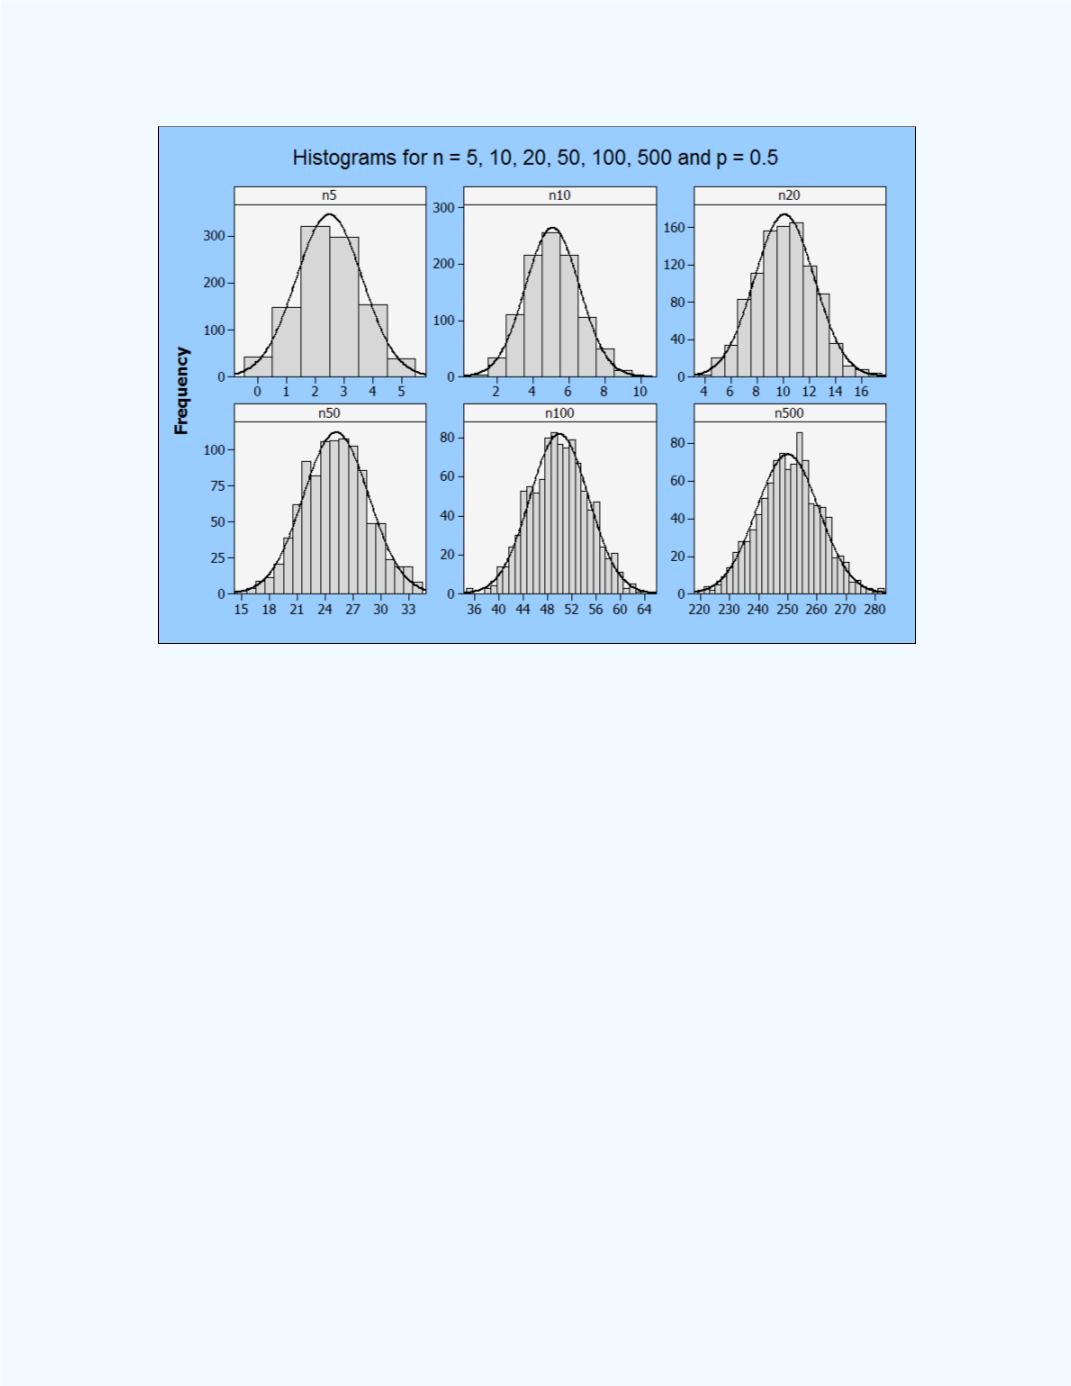
Figure 9-3:
The normal probability distribution approximation
as the limiting distribution for the binomial
distribution when
p
= 0.5
Figure 9-4
shows the histogram for 1,000 simulations from a binomial
distribution for
= 5, 10, 20, 50, 100 and 500, with
= 0.85. Observe that
as
n
increases for a fixed
= 0.85, the shape of the smooth curve becomes
increasingly bell-shaped. Also observe the initial left skew pattern of the
approximation becomes more symmetrical as the sample size
increased.