


 44 / 762

44
Chapter 1: Introduction and Graphical Displays
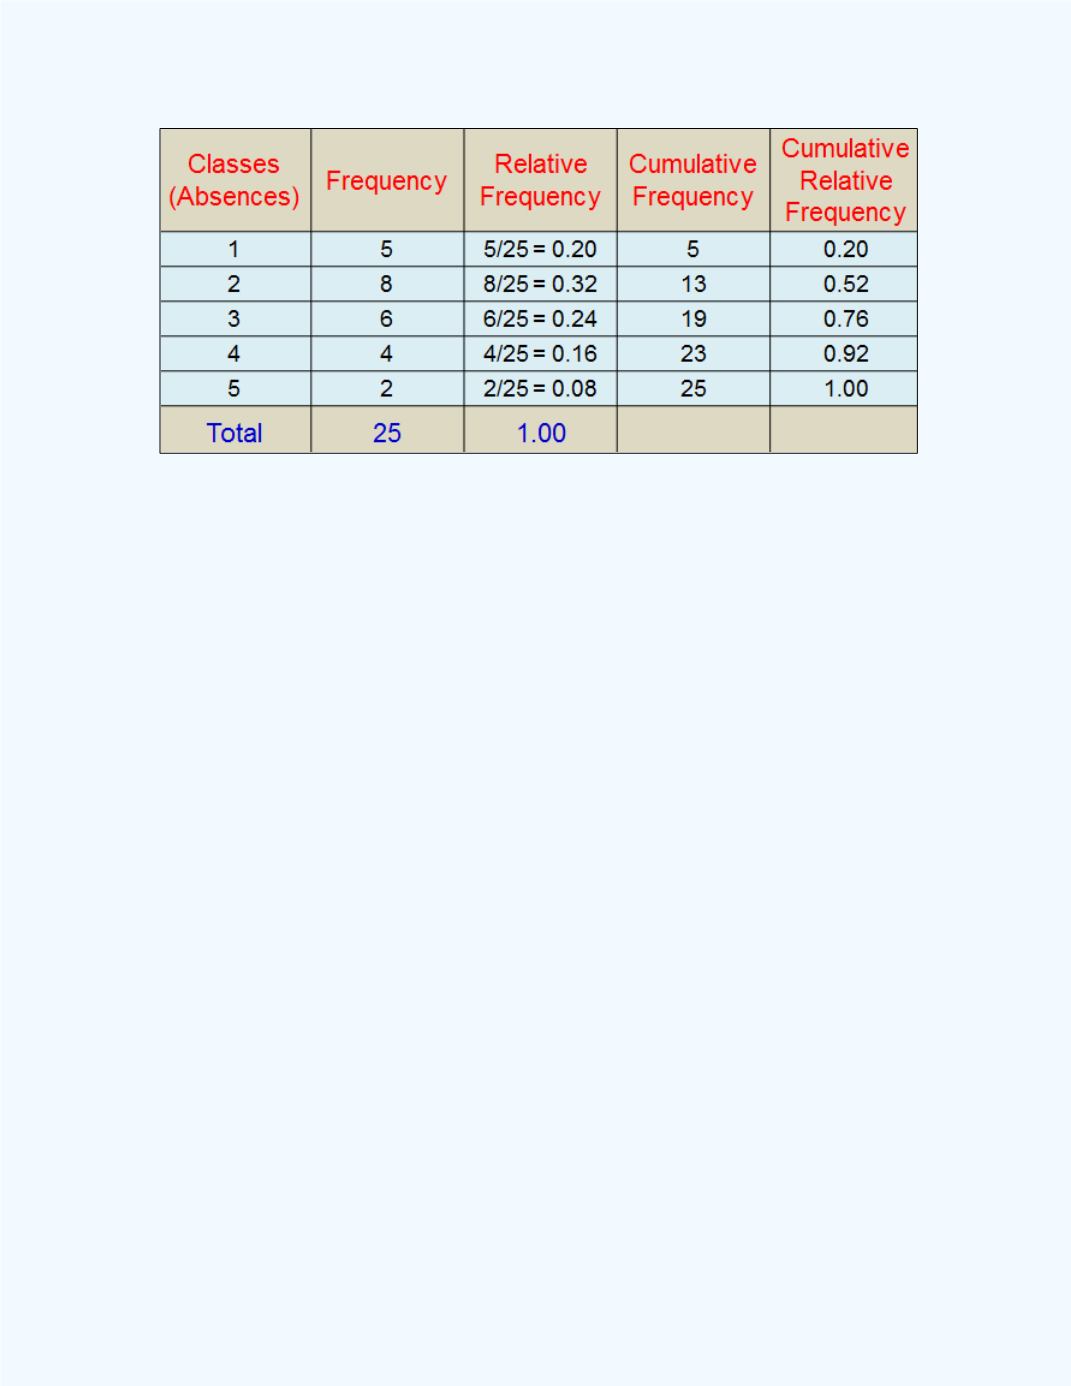
Figure 1-21
and
Figure 1-22
respectively display a frequency ogive and
relative frequency ogive for the table. We can use the
Cumulative
Frequency and Cumulative Relative Frequency
workbook to create these
ogives.
Observe that the frequency and the relative frequency ogives have the same
shape. Note also that we have to start the graph at (0, 0) in order to start the
accumulation of the frequencies or relative frequencies.