

 42 / 762

42
Chapter 1: Introduction and Graphical Displays
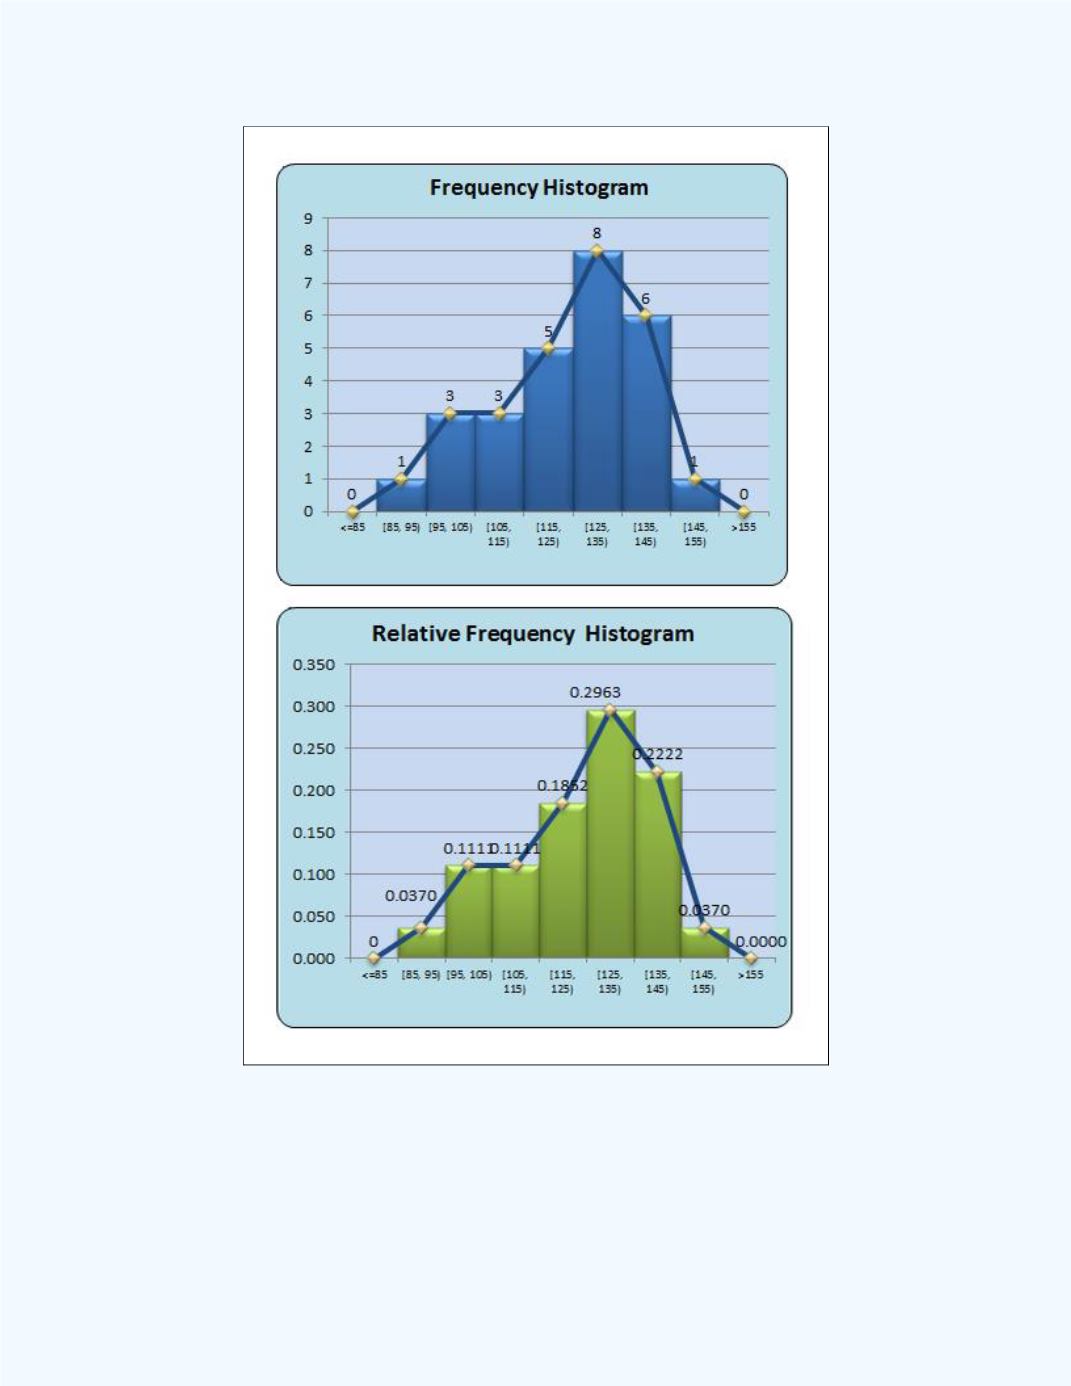
Figure 1-20:
Frequency polygon superimposed on
Histogram for the data in
Example 1-3


 42 / 762


 42 / 762
42
Chapter 1: Introduction and Graphical Displays
Figure 1-20:
Frequency polygon superimposed on
Histogram for the data in
Example 1-3