

 38 / 762

38
Chapter 1: Introduction and Graphical Displays
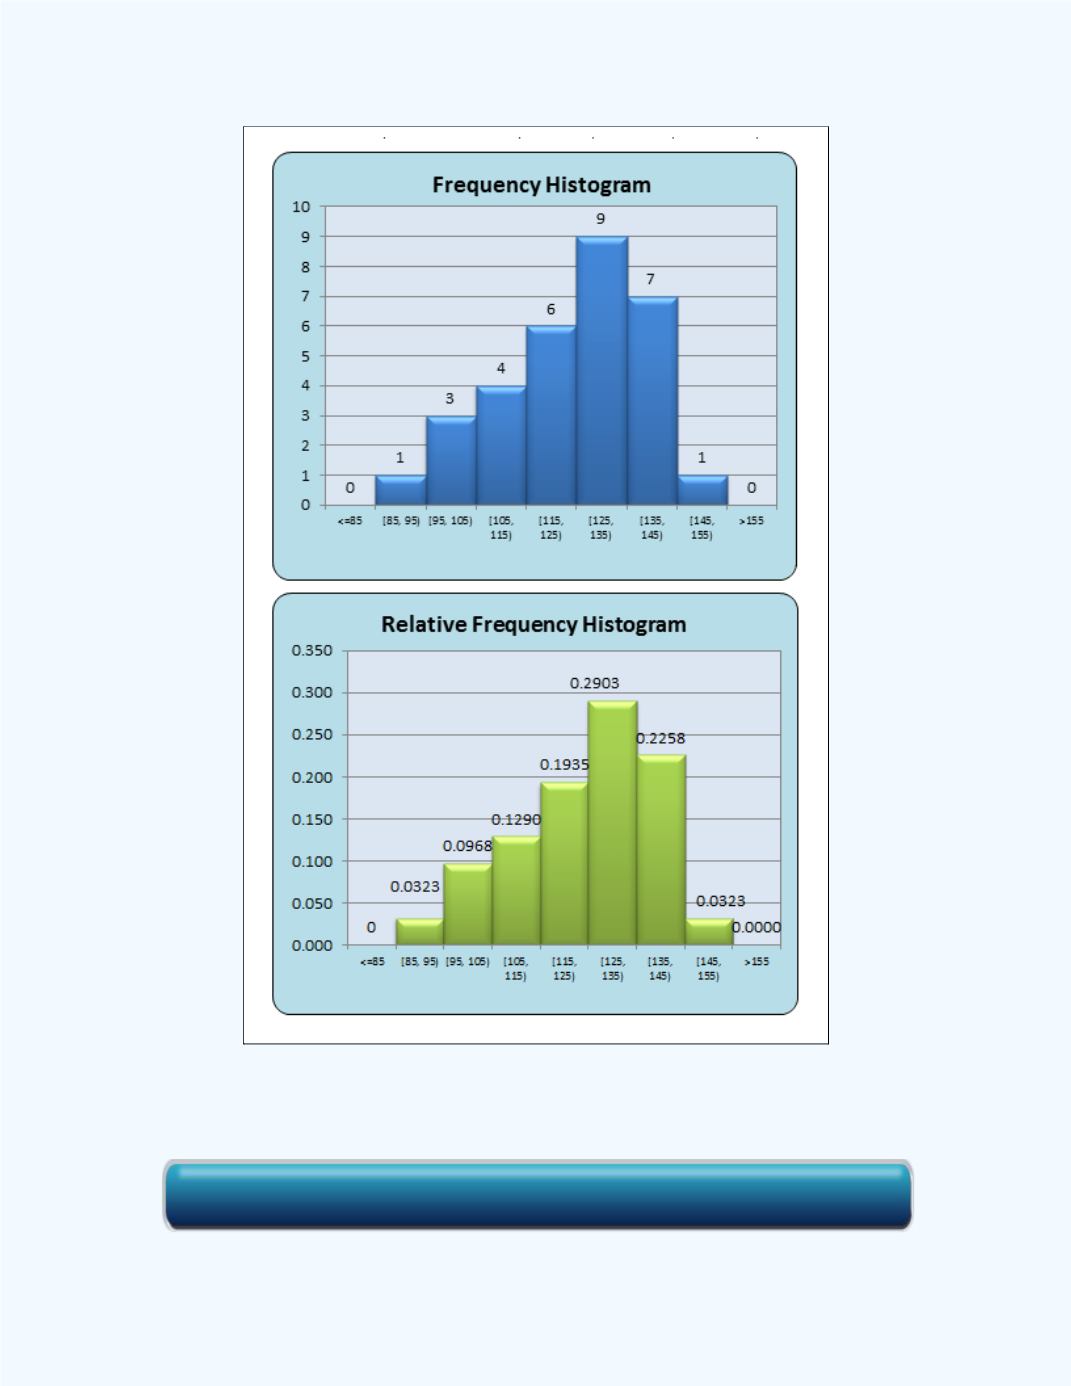
Figure 1-18:
Relative Frequency Histogram with
Seven classes for data in
Example 1-3
Click here for the Frequency and Relative Frequency Histogram Workbook


 38 / 762


 38 / 762
38
Chapter 1: Introduction and Graphical Displays
Figure 1-18:
Relative Frequency Histogram with
Seven classes for data in
Example 1-3
Click here for the Frequency and Relative Frequency Histogram Workbook