


 40 / 762

40
Chapter 1: Introduction and Graphical Displays
Solution:
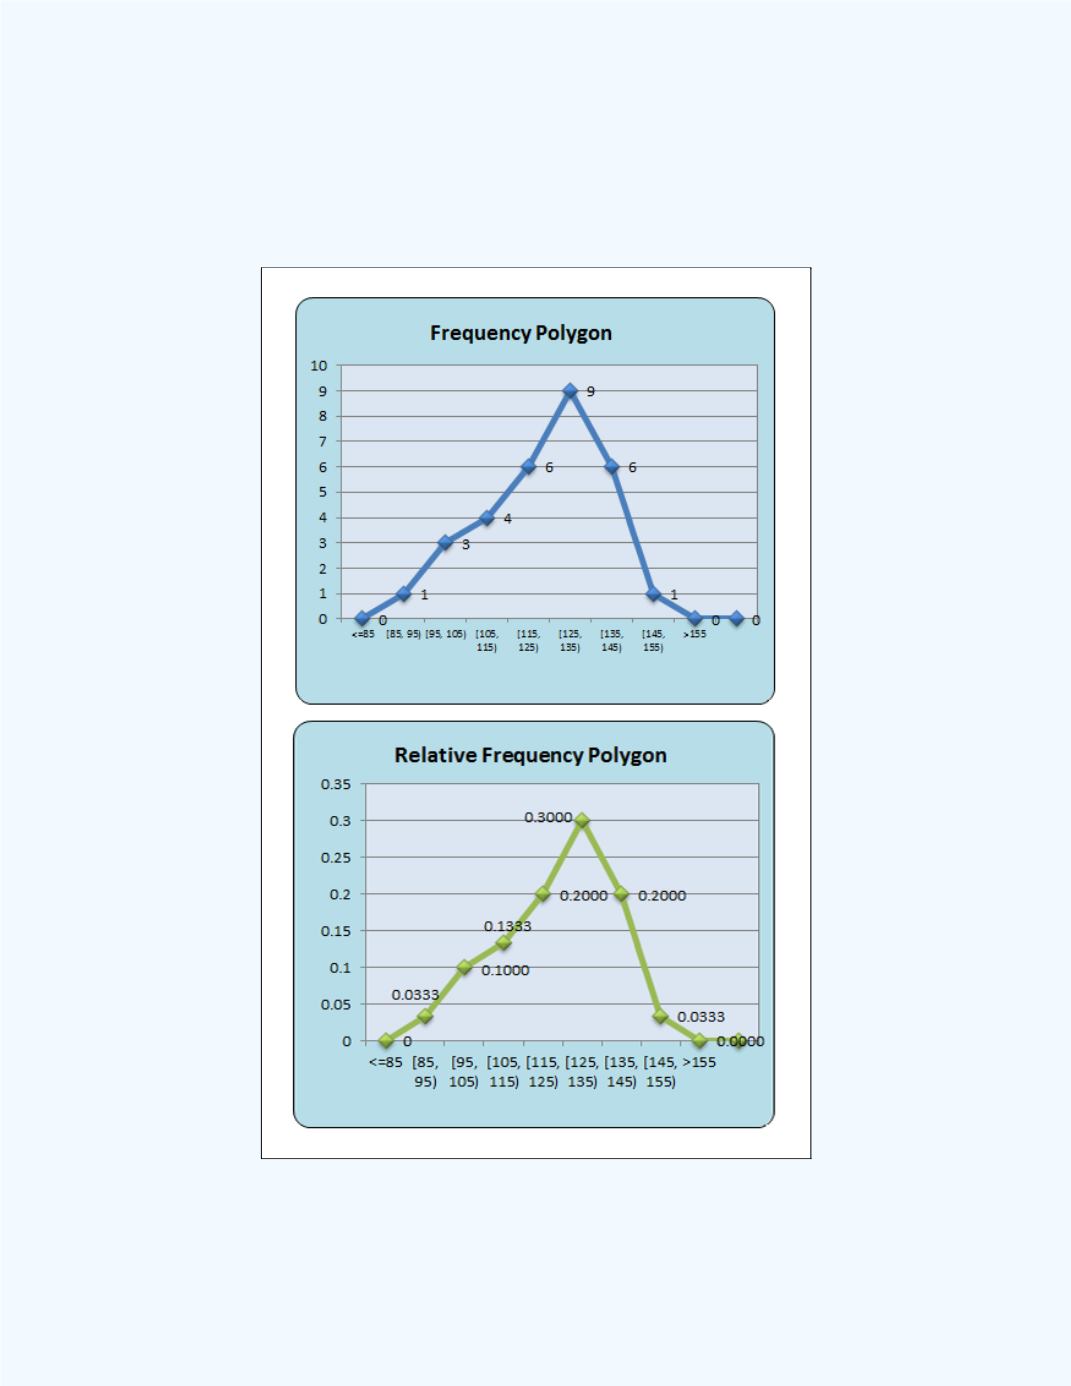
The displays given in
Figures 1-19
show a frequency polygon
and a relative frequency polygon for the data given in
Example 1-3
. These
graphs can be generated by using the
Frequency Polygon and Relative
Frequency Polygon from Raw Data
workbook.
Figure 1-19:
Frequency polygon for the data in
Example 1-3