


 36 / 762

36
Chapter 1: Introduction and Graphical Displays
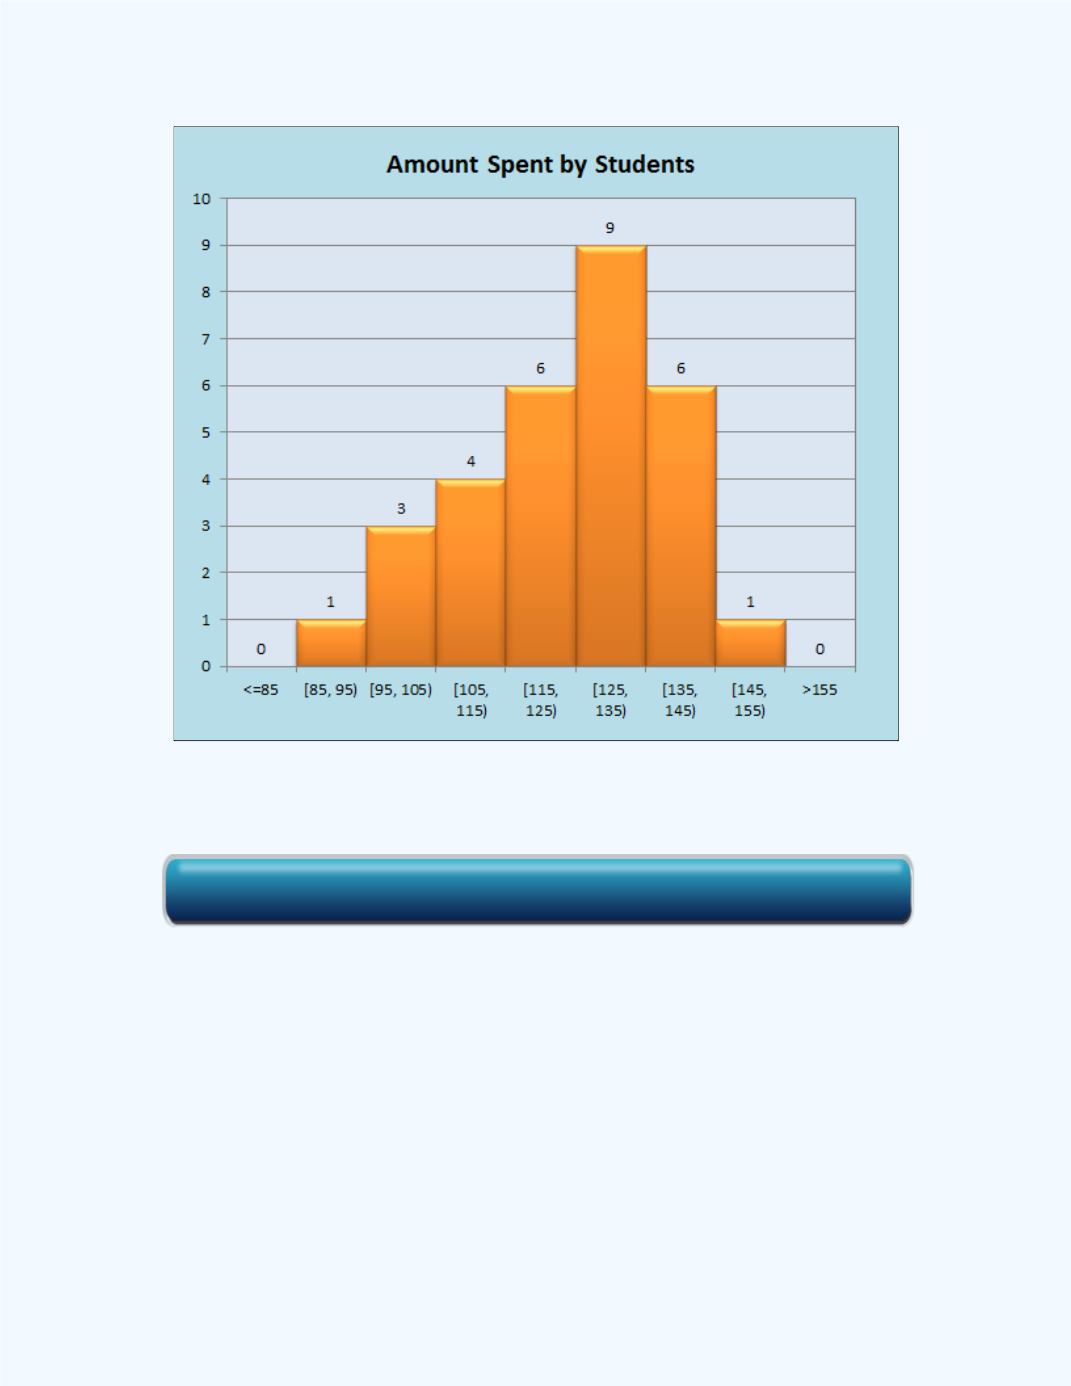
Figure 1-17:
Histogram with eight classes for
data in
Example 1-3
The histogram shows the frequency count for each class and with each class
having a class width of size 10.
Observe from the histogram in
Figure 1-17
that there is a frequency count of
1 for the interval [85 – 95), a frequency count of 4 for the interval
[105 – 115), etc. From this information, we can construct a grouped
frequency distribution with eight classes similar to
Example 1-3
. Observe
such a group frequency distribution will be displayed on the left hand side of
the histogram when the workbook is used.
Click here for the Histogram with Table from Raw Data Workbook