


 34 / 762

34
Chapter 1: Introduction and Graphical Displays
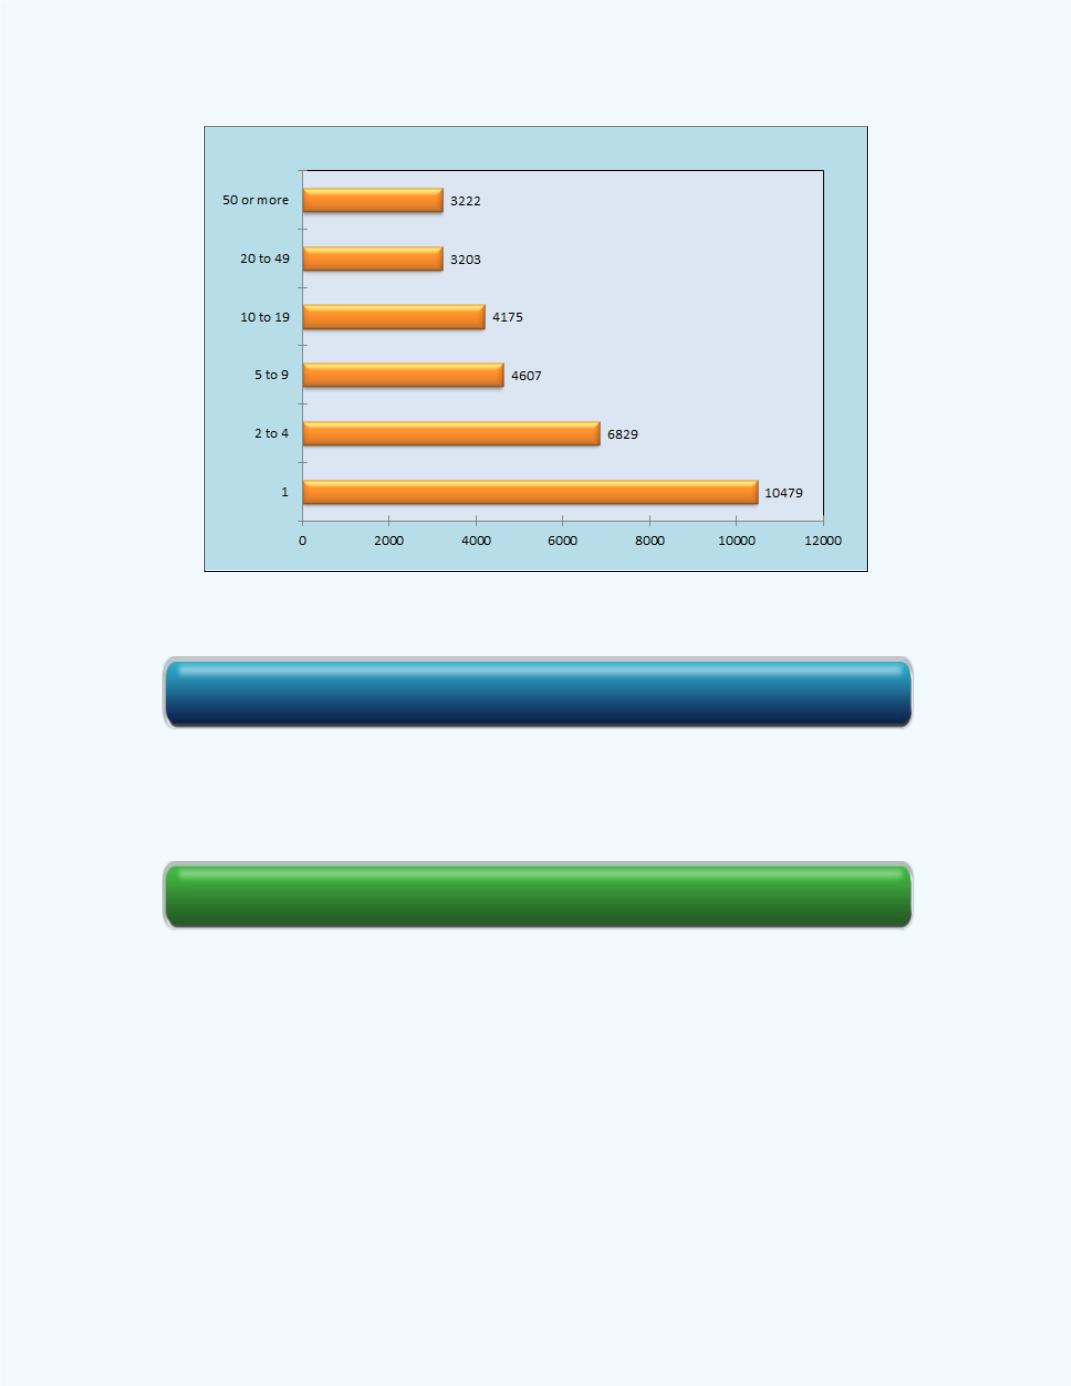
Figure 1-16:
Horizontal bar chart for
Example 1-6
Section Review
Following is a discussion about the histogram.
1- 5 Histograms
In this section we will deal with a graphical display which has many useful
features. We saw in an earlier section that we can use a histogram to help us
construct a group frequency distribution. Histograms are typically used to
display quantitative data. Following is a definition of the histogram.
Click here for the Horizontal Bar Chart Workbook e-Self Review