


 32 / 762

32
Chapter 1: Introduction and Graphical Displays
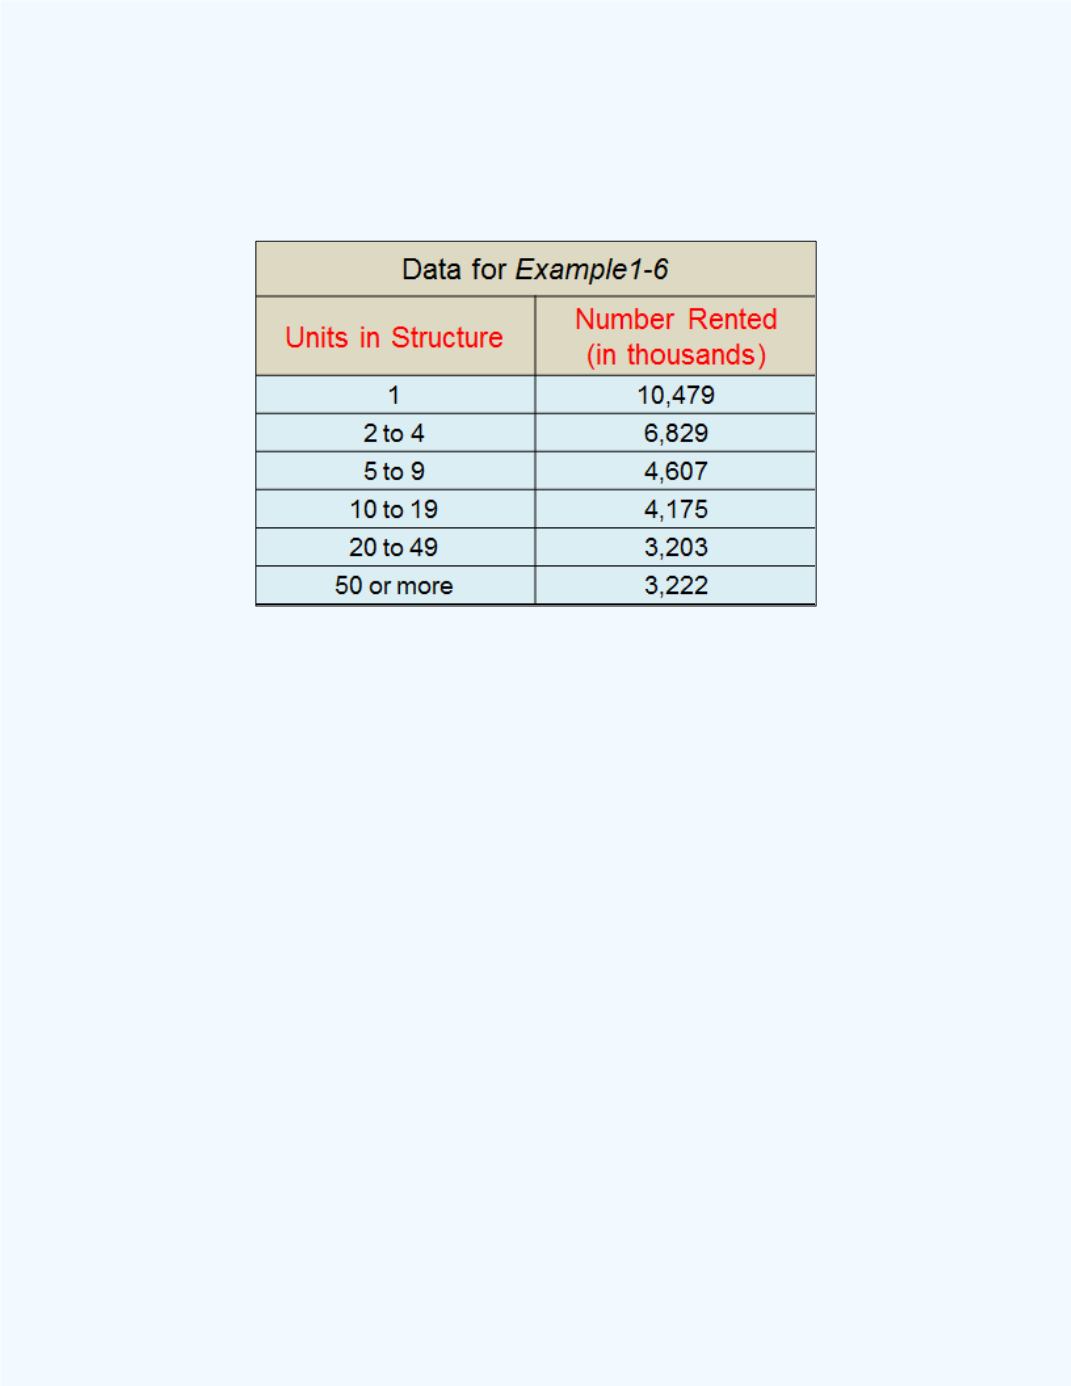
Table 1-6:
Frequency Distribution for
The Number of Units in a Structure and the
Number rented (in thousands)
Solution:
We can use the
Vertical Bar Chart
workbook
to create a
vertical bar chart.
Observe that the
Units in Structure
variable is categorical
or qualitative (1, 2 to 4, 5 to 9, etc.). The vertical bar chart for this
information is shown in
Figure 1-15
. The number at the top of each
category represents the number of values (frequencies) for that specific
group (number of units in the structure).