


 27 / 762

Chapter 1: Introduction and Graphical Displays
27
convention that will be used here is that
the upper limit of each class is not
included in the interval of values
, only the lower limit values are included
in the interval. Thus, the value of 95 is only included in the interval of
values for the first class of [95, 105). In addition, the relative frequency for
each class is presented as well as the percentage equivalent in
Table 1-5
.
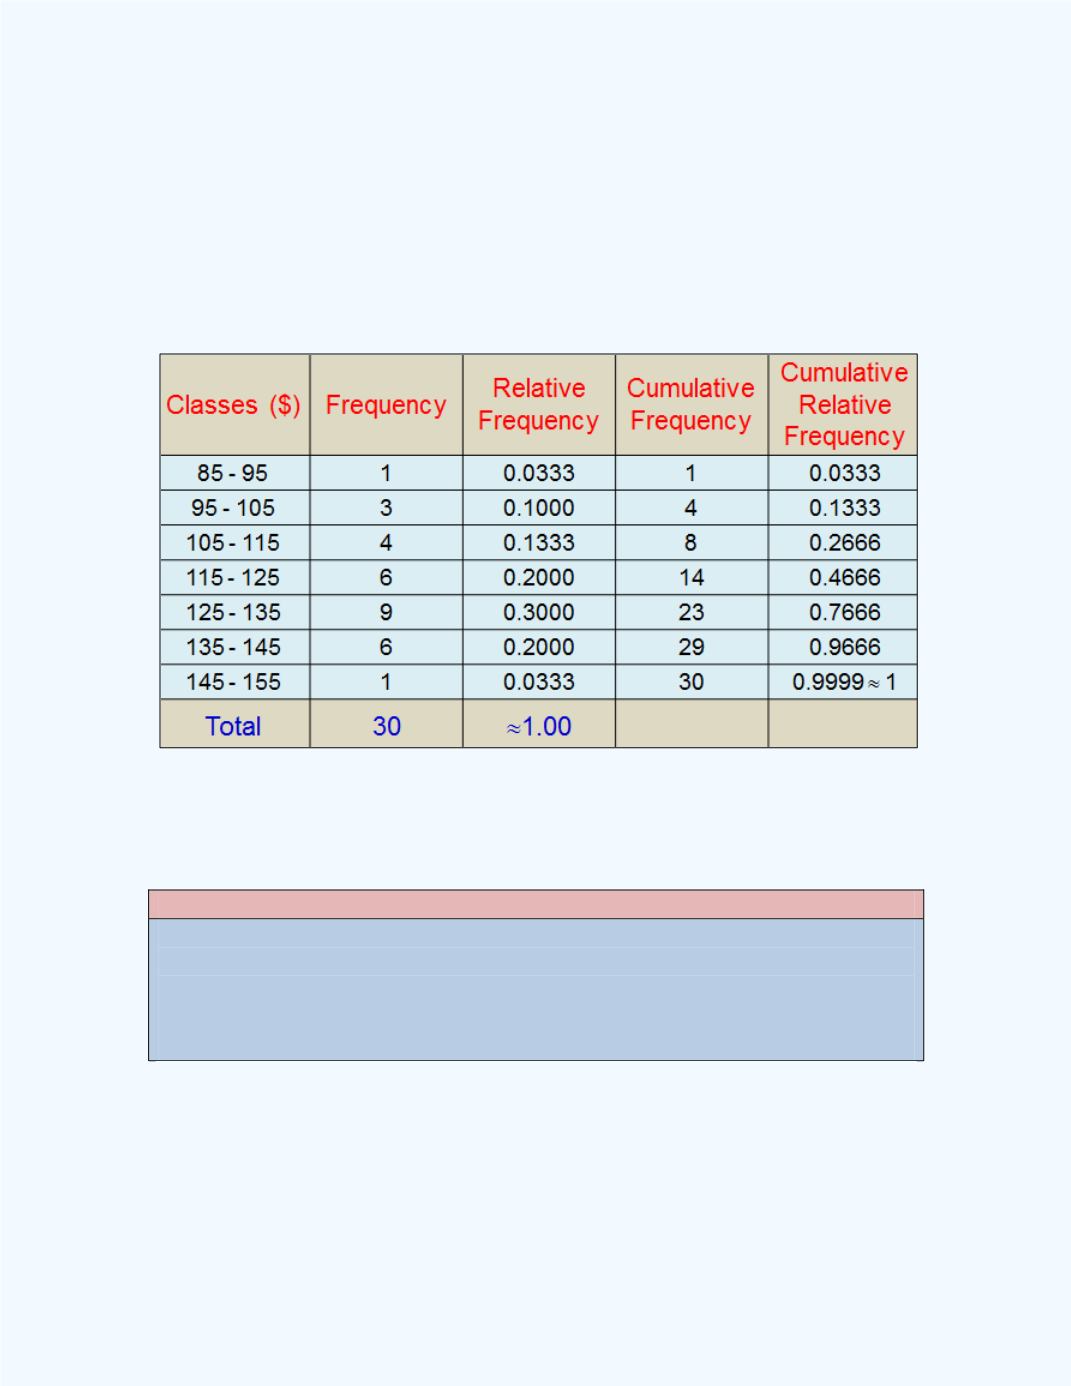
Table 1-5:
Grouped frequency Distribution for
Example 1-3
Note
:
The
class width
for this frequency distribution is 10. It is obtained by
subtracting the lower class limit for any class from the lower class limit for
the next class. For the third class, the class limit = 115 – 105 = 10.
Note:
In the group frequency distribution, observe that the relative frequency
column did not add up to exactly 1. This is due to rounding of the relative
frequency values to two decimal places.
We can also use the
Extended Frequency Table for Money Spent by
Students
workbook.
Figure 1-12
shows the extended frequency table.
Observe that the values are the same as those displayed in
Table 1-5
.