


 33 / 762

Chapter 1: Introduction and Graphical Displays
33
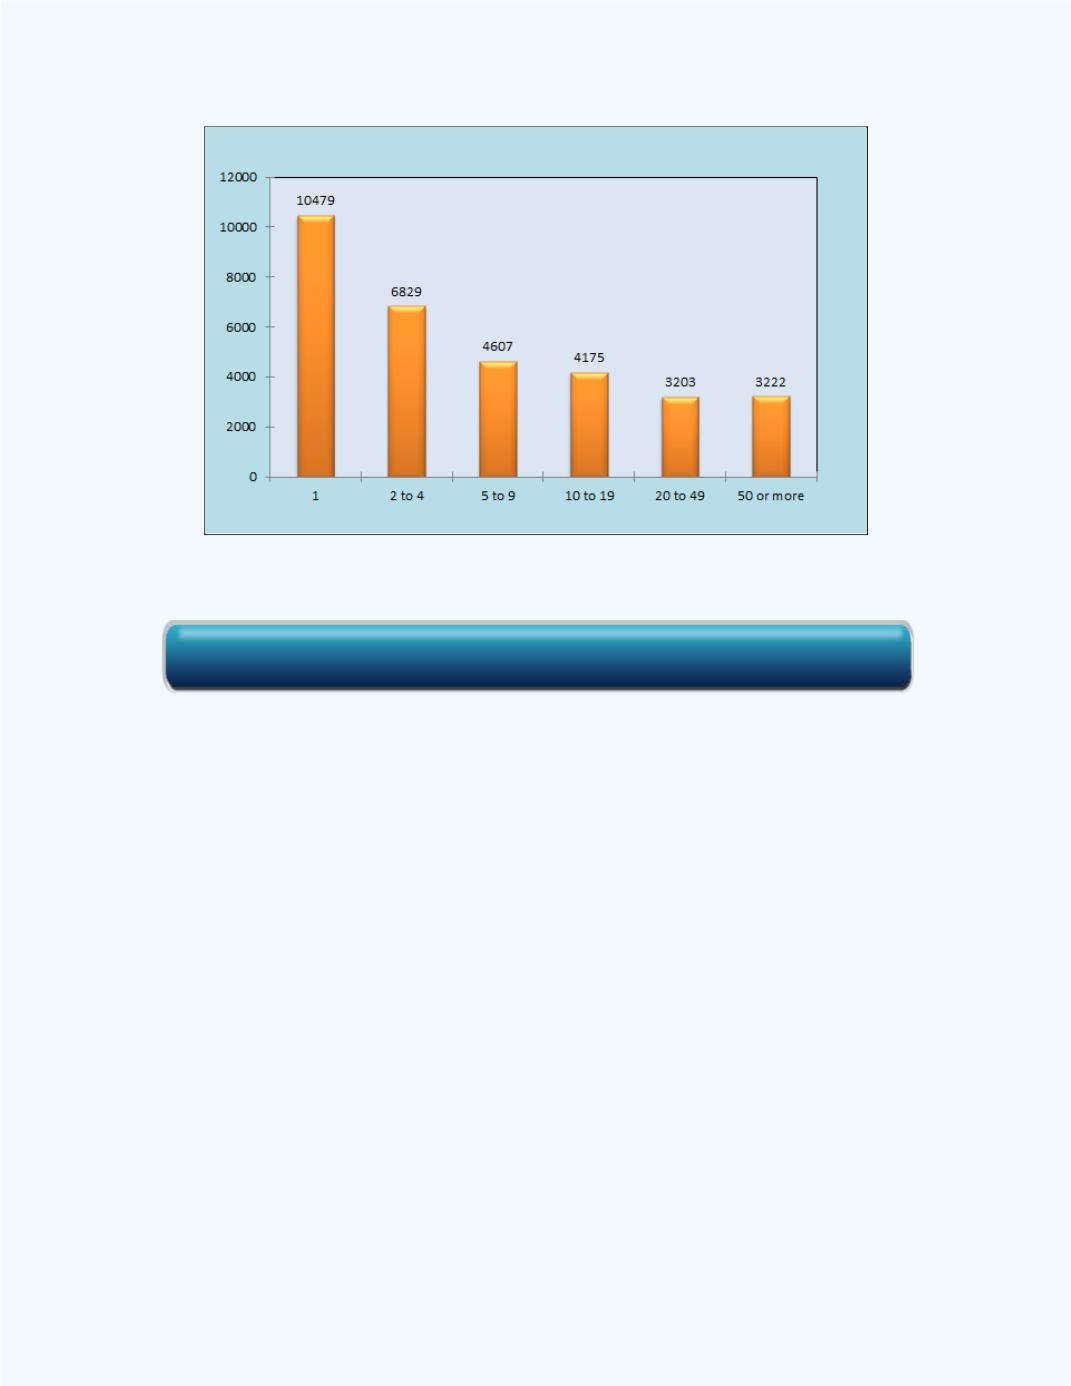
Figure 1-15:
Vertical bar chart for
Example 1-6
A horizontal bar chart for the same housing information is shown in
Figure
1-16
. You can edit the vertical bar chart to obtain the horizontal bar chart by
just right clicking on the graph and select chart type. Note if the sheet is
protected, you will need to unprotect first in order to make any changes.
Alternatively, you can use the
Horizontal Bar Chart
workbook
to create a
horizontal bar chart. Observe in both charts that the most frequently
occurring value for the
Units in Structure
variable is 1 with a frequency
count of 10,479.
Click here for the Vertical Bar Chart Workbook