


 30 / 762

30
Chapter 1: Introduction and Graphical Displays
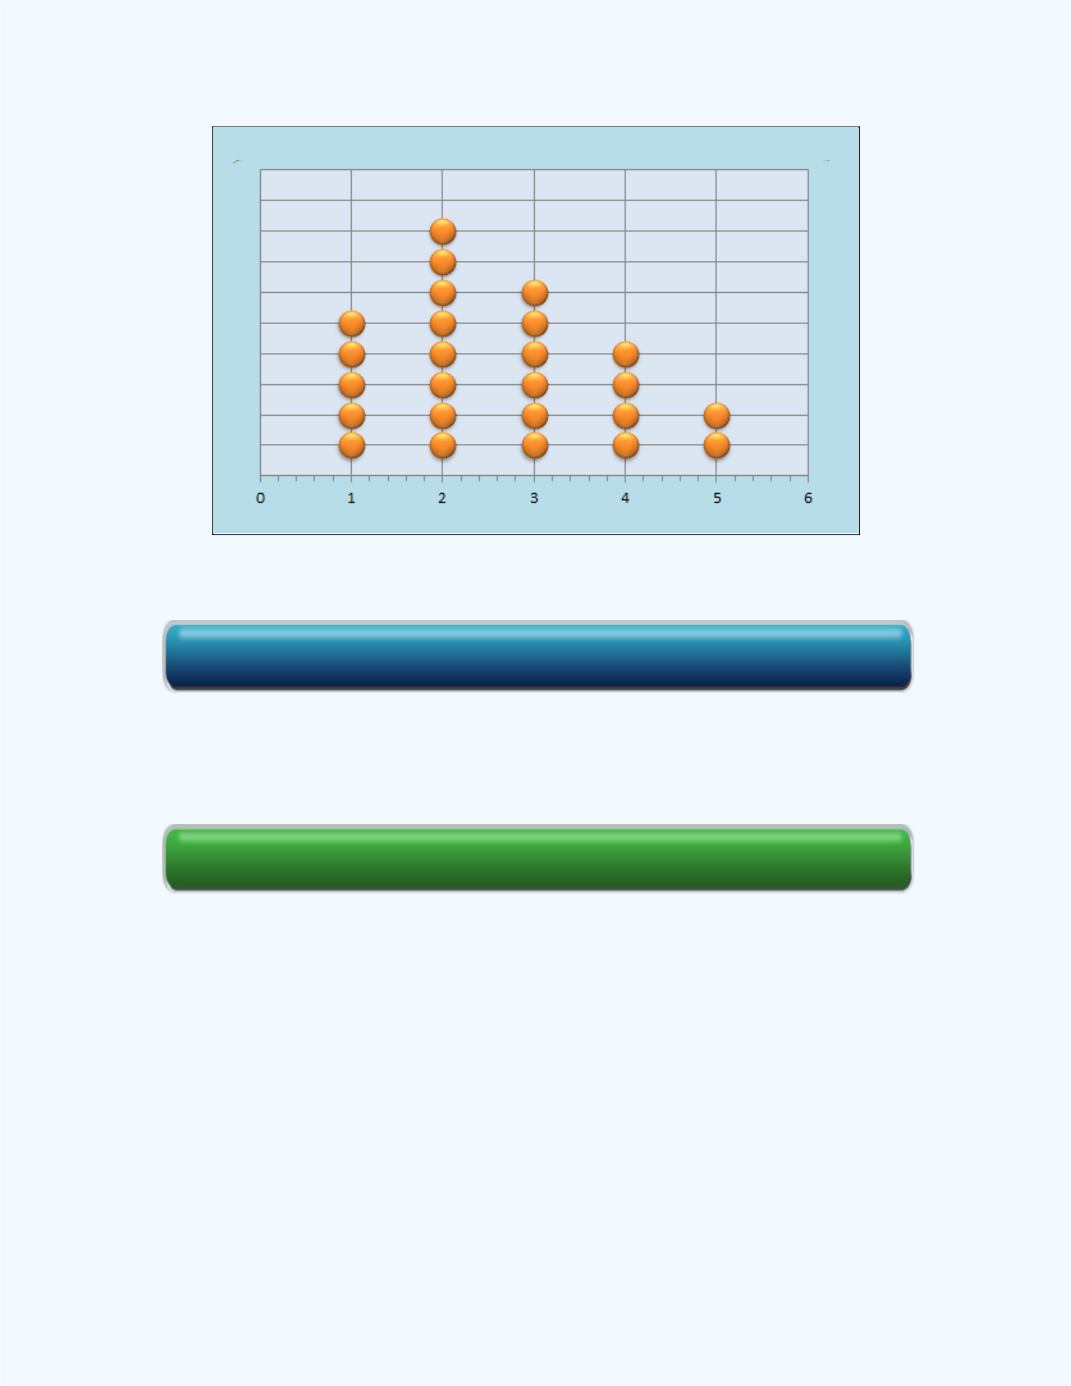
Figure 1-14:
Dot plot for
Example 1-2
Section Review
1- 4 Bar Charts or Bar Graphs
Another useful graphical display which we can use to visualize data is called
a
bar chart
or
bar graph
. A bar chart is useful when the data values are
qualitative in nature.
Click here for the Dot Plot from Raw Data Workbook e-Self Review