


 46 / 762

46
Chapter 1: Introduction and Graphical Displays
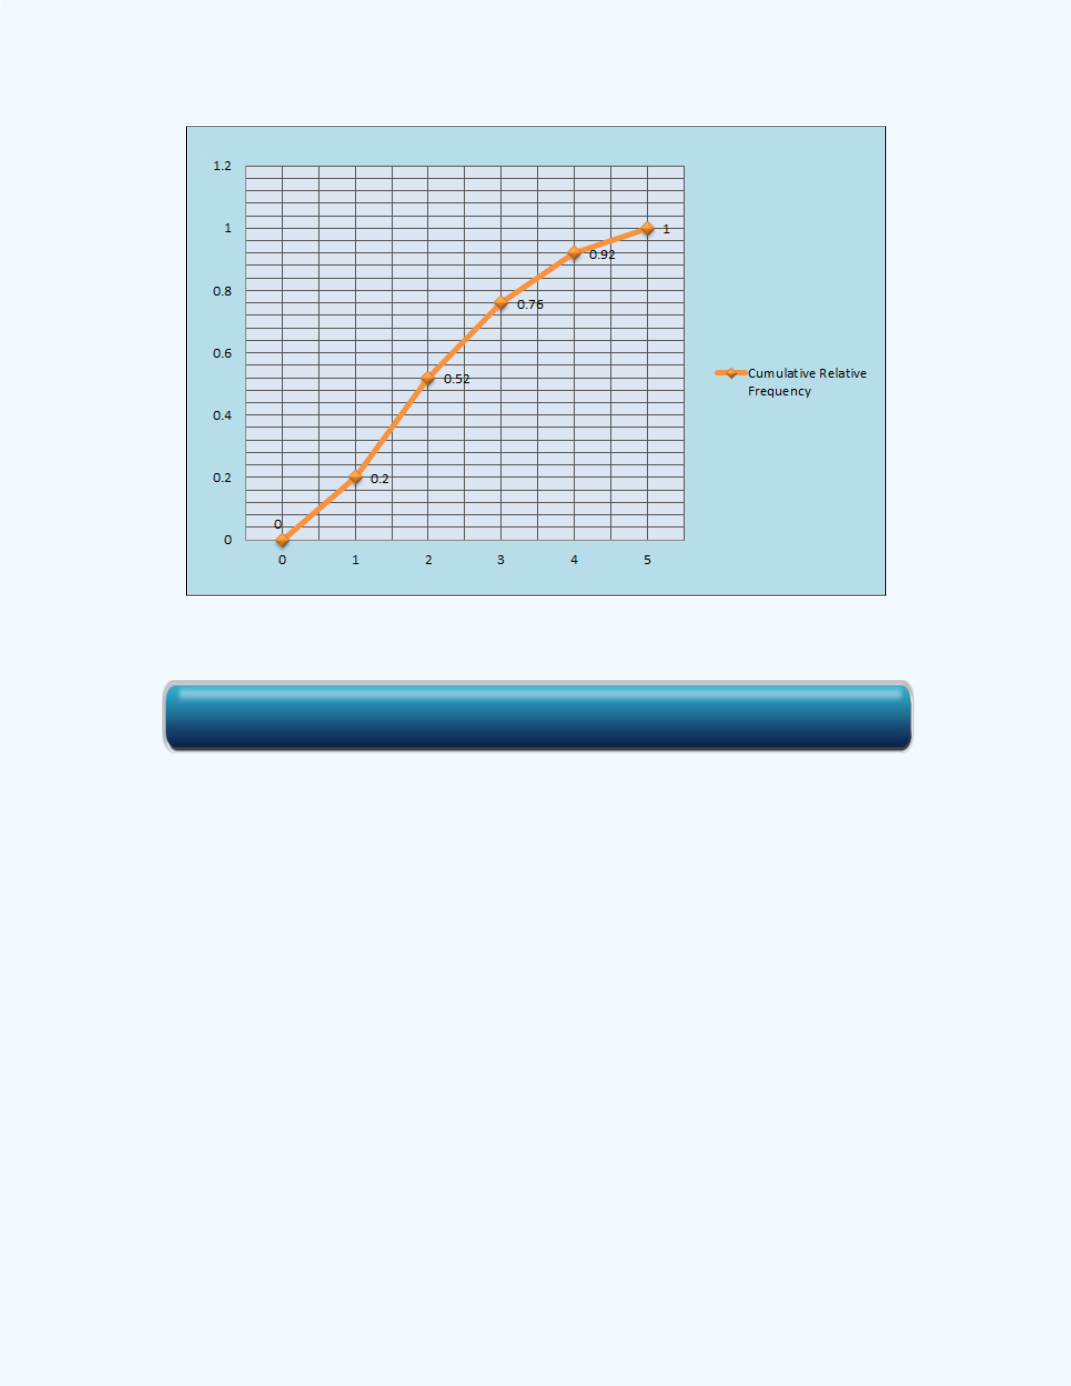
Figure 1-22:
Relative Frequency Ogive for
Table 1-4
As stated above, if the data is grouped, then we will have to use the upper
boundaries for the intervals to represent the ogives.
Example 1-10:
Use the histogram from
Example 1-3
to construct a
frequency ogive and a relative frequency ogive. The histogram is repeated
below for reference.
Click here for the Cumulative Relative Frequency Workbook