

 47 / 762

Chapter 1: Introduction and Graphical Displays
47
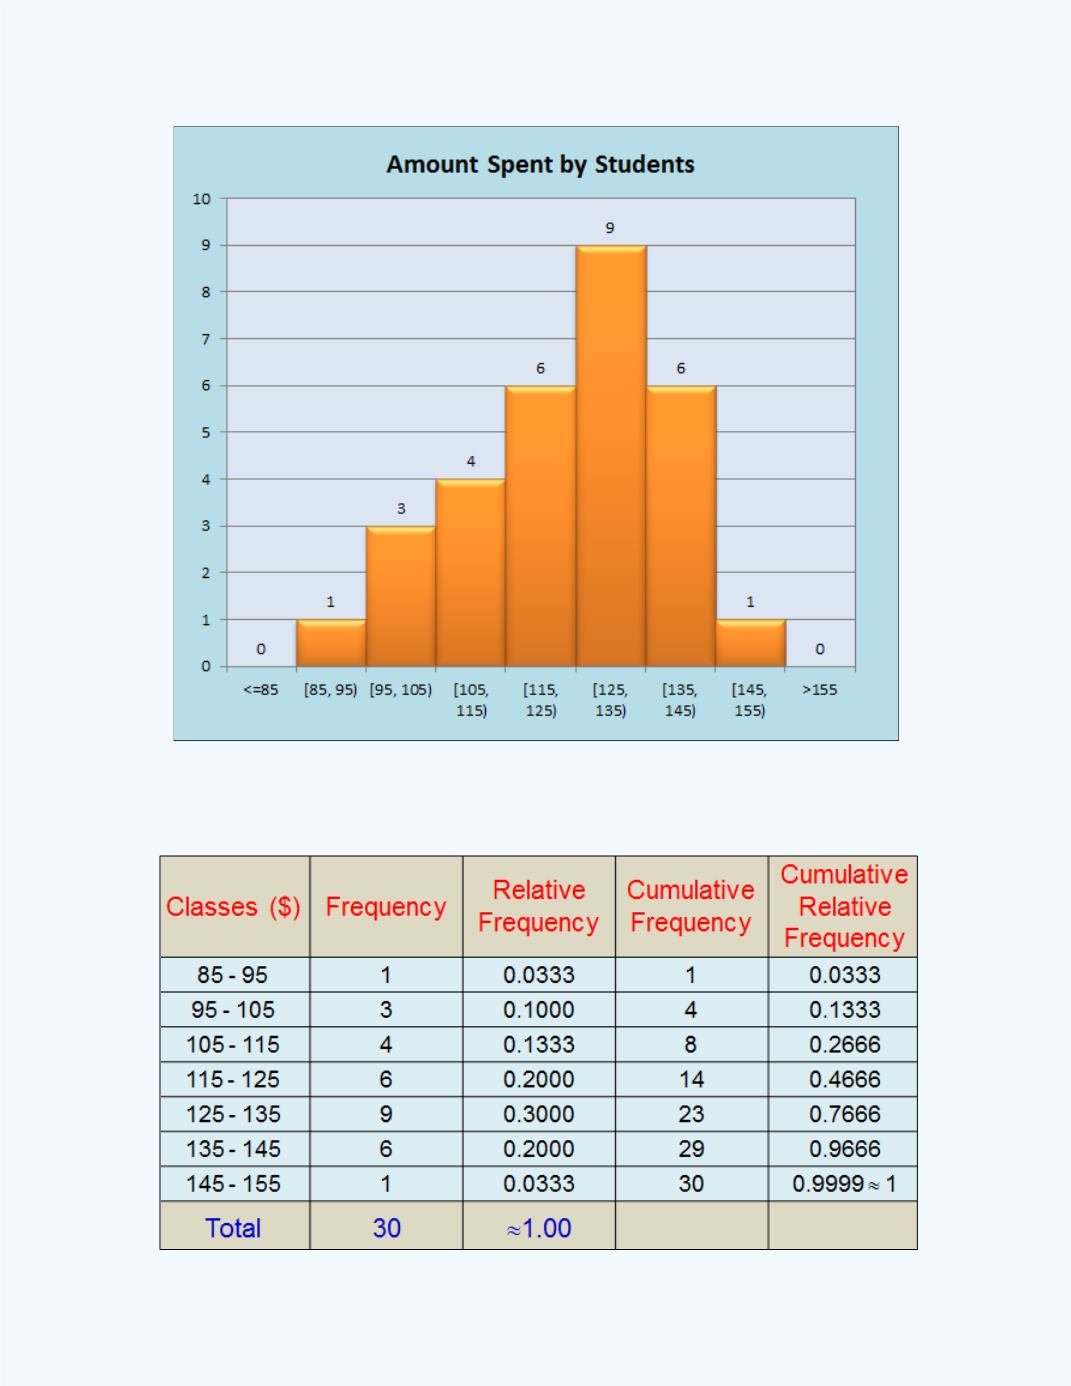
From the histogram, we can extract the information to construct a frequency
and relative frequency distribution. This table is given below.


 47 / 762


 47 / 762
Chapter 1: Introduction and Graphical Displays
47
From the histogram, we can extract the information to construct a frequency
and relative frequency distribution. This table is given below.