


 53 / 762

Chapter 1: Introduction and Graphical Displays
53
Table 1-10:
Stem-and-Leaf Plot
with the Unit and Tens Digits as
the Leaves for
Example 1-10
These two illustrations show that the resulting stem-and-leaf plot depends on
what stem and what leaf are used to divide the data values.
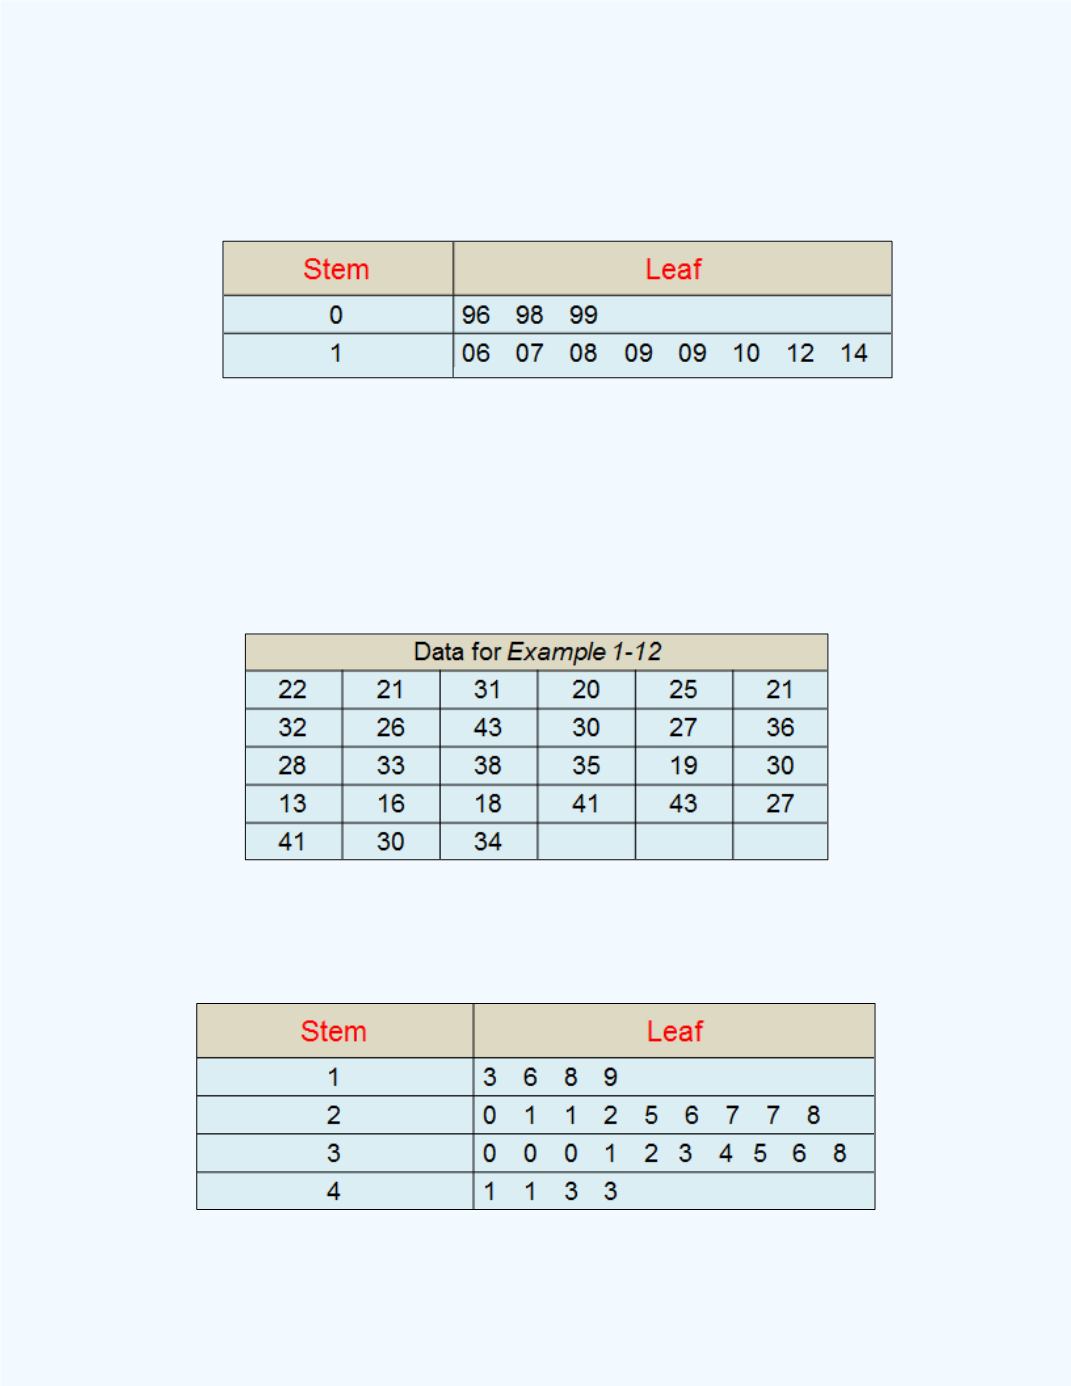
Example 1-12:
A sample of 27 days of the number of persons waiting in
the emergency waiting room at a local hospital at 9:00 a.m. is given below.
Display the data using a stem-and-leaf plot with the leaves represented by
the unit digits.
Solution:
The stem and leaf display for the data is given in
Table 1-11
.
Table 1-11:
Stem-and-Leaf Display for
Example 1-10