


 55 / 762

Chapter 1: Introduction and Graphical Displays
55
Definition: Time Series Graph
A time series graph is a plot which displays data that are observed over a
given period of time.
From a time series graph one can observe and analyze the behavior of the
data over time.
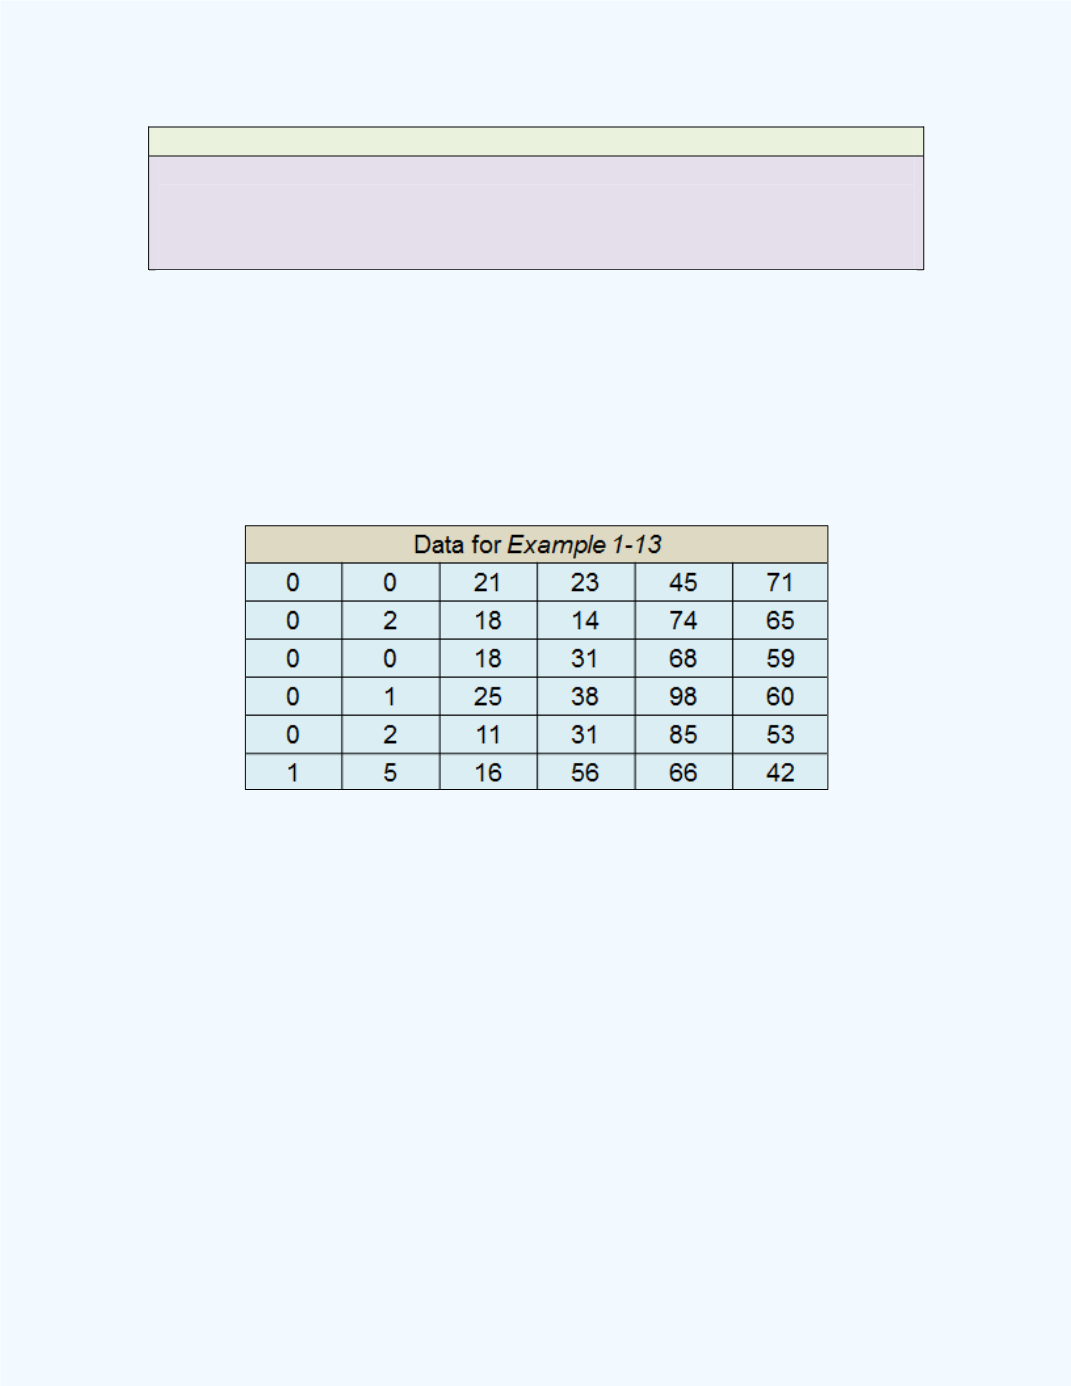
Example 1-13:
The following table gives the number of executions in the
USA for the years 1972 to 2007. The values are read by the columns
starting at 0 (1972), 0 (1973), …, 0 (1976), 1 (1977), 0 (1978), 2 (1979), etc.
Plot a time series graph.
Solution:
We can use the
Time Series Plot for a Single Variable
workbook to help generate this graph. The time series plot for the data is
shown in
Figure 1-26
.