


 57 / 762

Chapter 1: Introduction and Graphical Displays
57
Data source:
http://professionals.collegeboard.com/profdownload/cbs-08- Page-2-Table-2.pdfSolution:
We can use the
Time Series Plot for Two Variables
workbook
to help generate this graph. The time series plot for the data is shown in
Figure 1-27
.
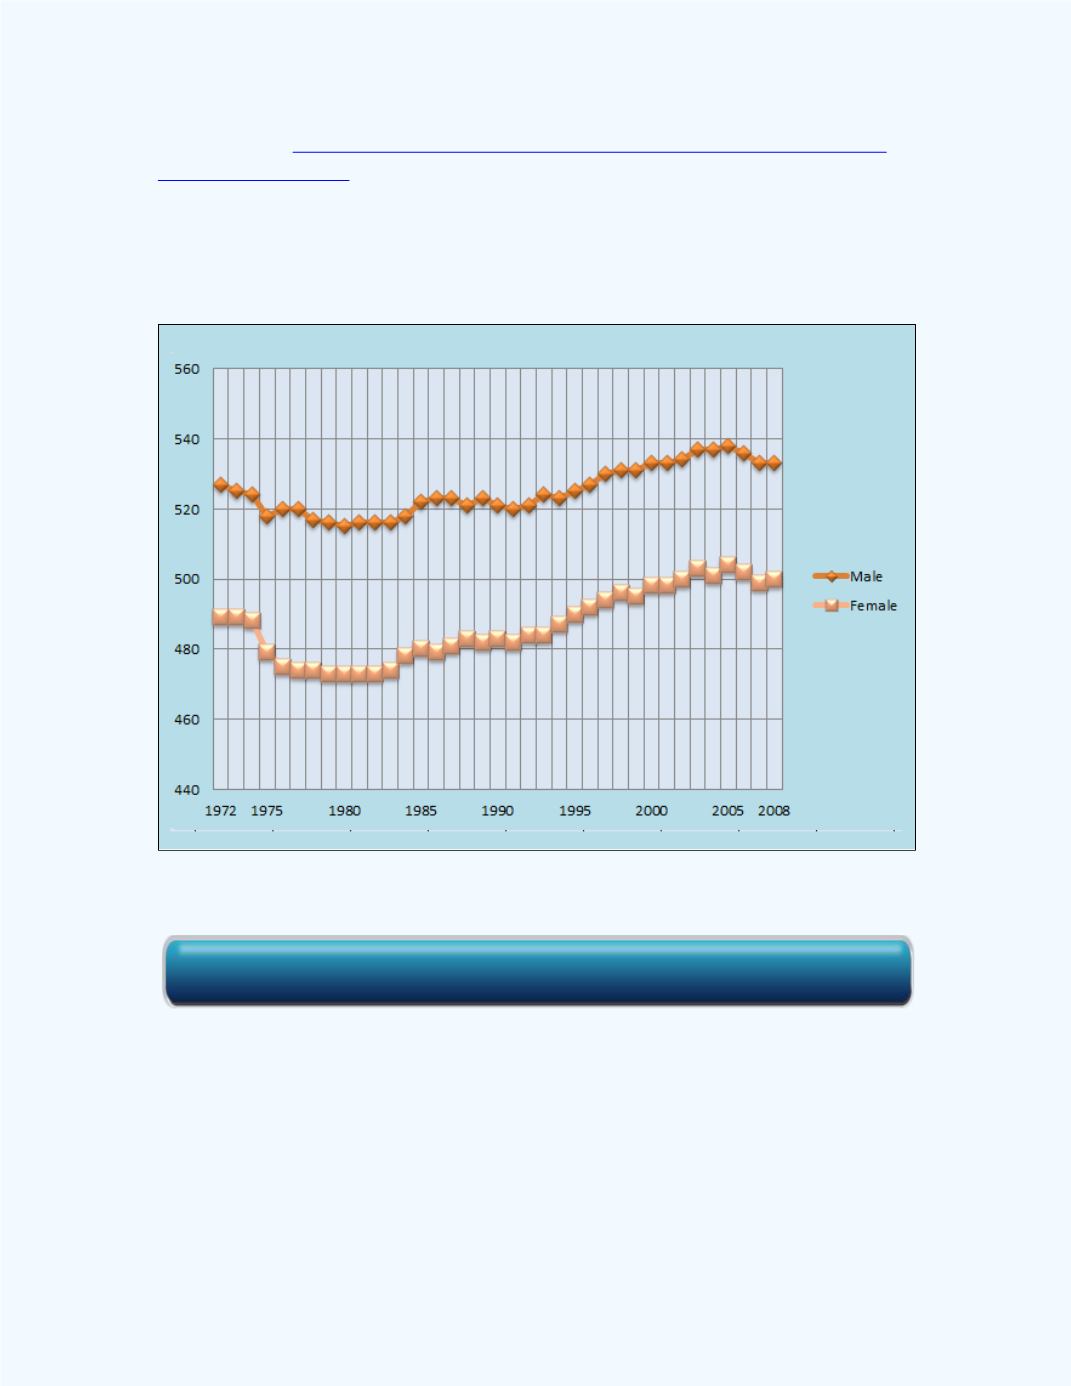
Figure 1-27:
Time series plot for
Example 1-14
Observe from
Figure 1-27
that the male students consistently outperformed
the female students on the SAT Mathematics exam from 1972 to 2008.
Note:
If we had time series values for grouped data, we can use the
Time
Series Plot from Grouped Data
to create the graph.
Click here for the Time Series Plot for Two Variables Workbook