


 60 / 762

60
Chapter 1: Introduction and Graphical Displays
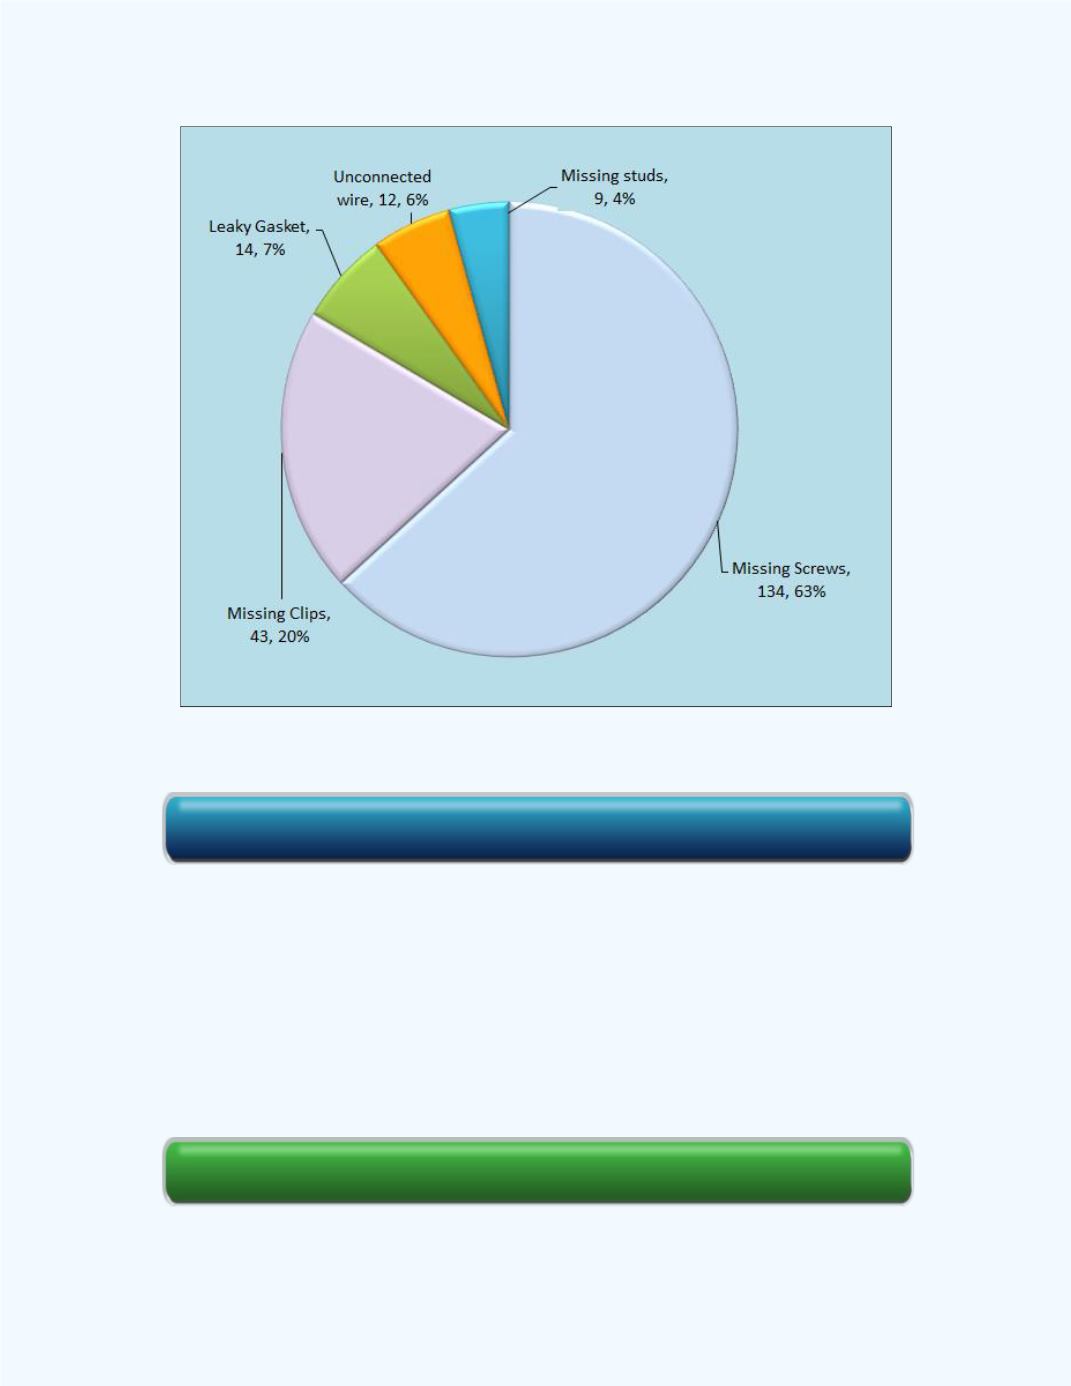
Figure 1-29:
Pie chart for the Number of Defectives
Each slice of the pie chart represents a category for the class defects with its
frequency count and the corresponding percentage for the count in that class.
The sector representing the missing screws category displays the largest
percentage for the defects.
Section Review
e-Self Review Click here for the Pie Chart for Table Data Workbook