


 66 / 762

66
Chapter 2: Measures of Central Tendency
Next we will introduce the idea of the population mean.
Definition: Population Mean
The mean of a population of numerical data values is the arithmetic average
for the set of values.
Notation:
The population mean is usually denoted by the Greek symbol
.
This notation is read as “mu”.
Following is an example which will illustrate how the mean is computed and
how to interpret the value.
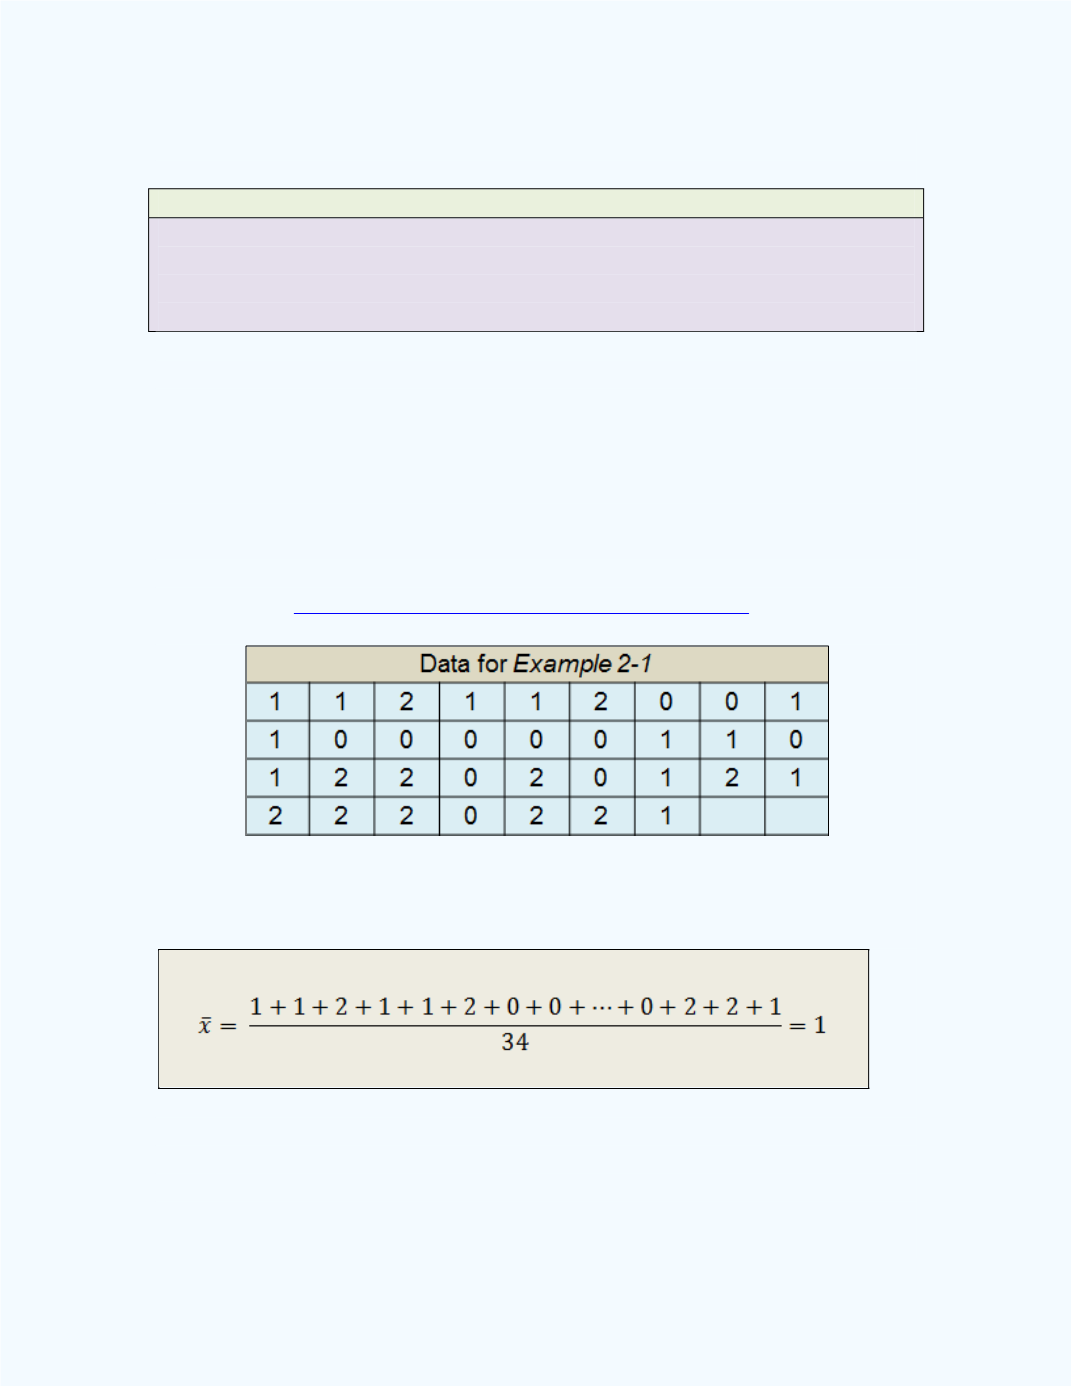
Example 2-1:
The following data set represents the number of major
hurricanes listed from 1851 to 1884. What is the mean for the data set?
Data Source
:
http://www.aoml.noaa.gov/hrd/tcfaq/E11.htmlSolution:
Since the data represents a sample, then we will compute the
sample mean. It is obtained as
That is, the value of the sample mean is 1.
We can also use the
Basic Statistics
workbook to compute the mean. The
result is shown in
Figure 2-1
when the data was entered into the Data 1
column.