


 67 / 762

Chapter 2: Measures of Central Tendency
67
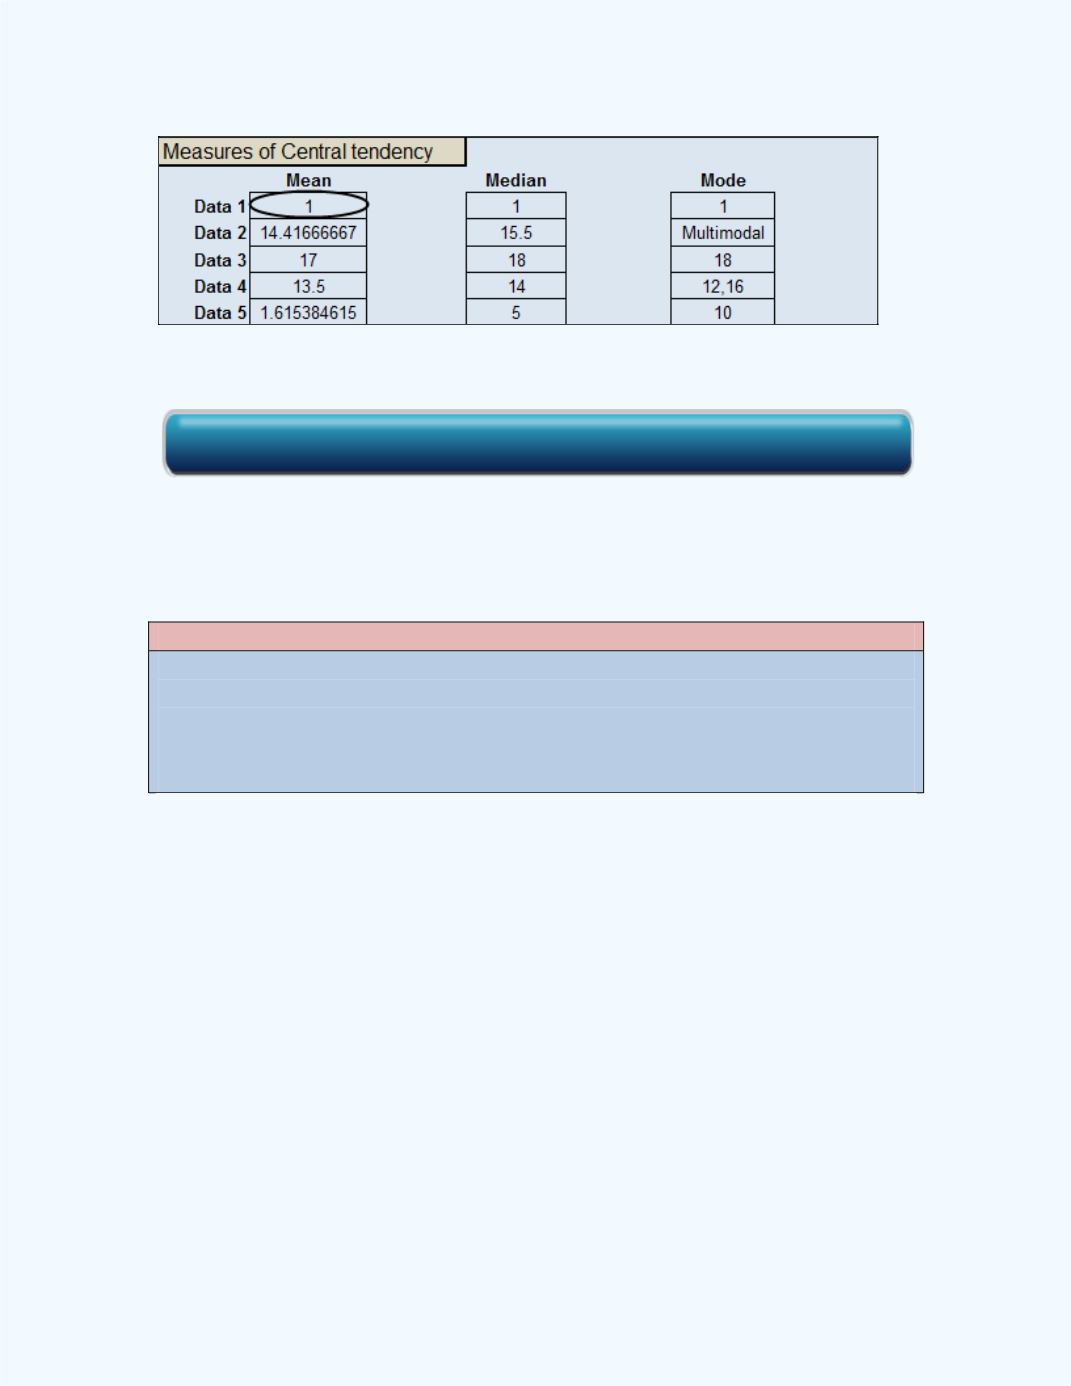
Figure 2-1:
Computed Mean for
Example 2-1
Note:
This
Basic Statistics
workbook can compute means for up to five
data sets. The data for this problem is identified as Data 1. Observe the
mean for Data 1 is 1.
Note:
The mean or average is used in everyday conversation and has come to
represent a typical value or the center of a set of values. Because of this, the
mean is called a measure of central tendency.
Question:
Why do we use the mean as a measure of the center of a
set of data values?
The following discussion will help to answer this question. First,
Figure 2-2
shows a dot plot of the data points with the location of the
sample mean.
Click here for the Basic Statistics Workbook