


 72 / 762

72
Chapter 2: Measures of Central Tendency
Recall from Chapter 1, that one way to present a data set is through a
frequency table. The frequency will represent the number of times each
value occurs. The next example shows us how to find the mean of a set of
values when the data are summarized in a frequency table.
Example 2-2:
A sample of the oldest documented human beings, in years,
is given below.
113, 112, 112, 113, 113, 116, 115, 113, 115, and 113.
Summarize the information with an ungrouped frequency distribution and
then use the information in the frequency table to determine the mean of the
sample.
Solution:
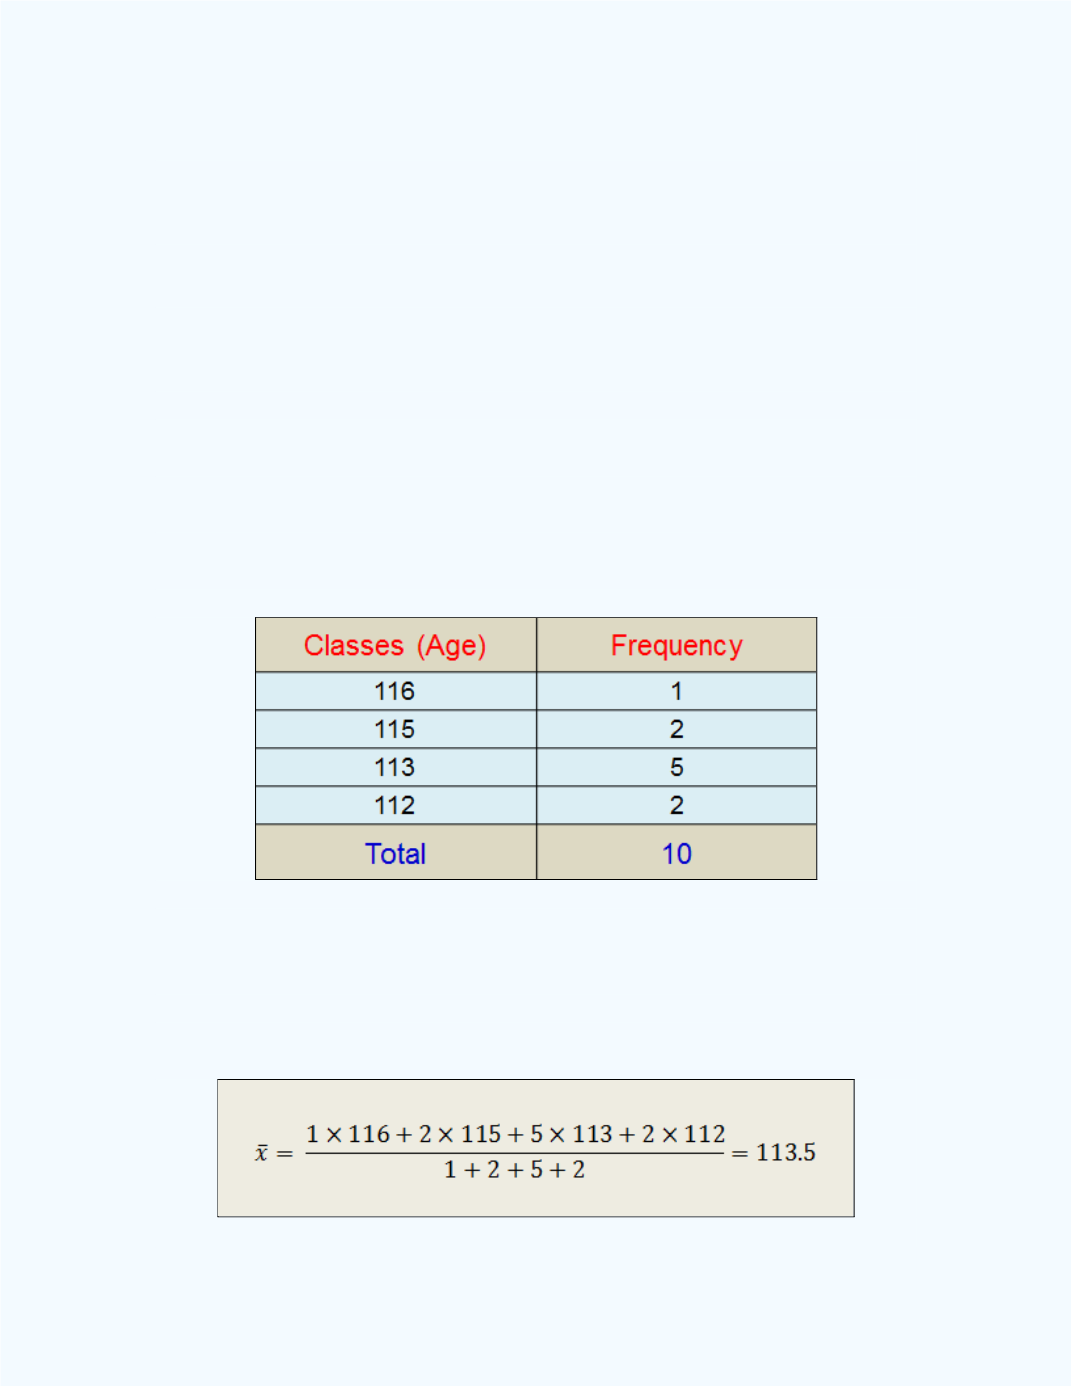
Since the data set is rather small, one can just tally the data. The
ungrouped frequency distribution is as follows.
Observe for instance that the value of 115 has a frequency count of 2, so the
total or sum can be written as 115 + 115 or 2
115. We can do the same for
each of the values and its corresponding frequency count in the table. The
total number of values in the table is 10, which is the sum of the frequency
values. Thus, we can compute the mean for the frequency distribution as: