


 76 / 762

76
Chapter 2: Measures of Central Tendency
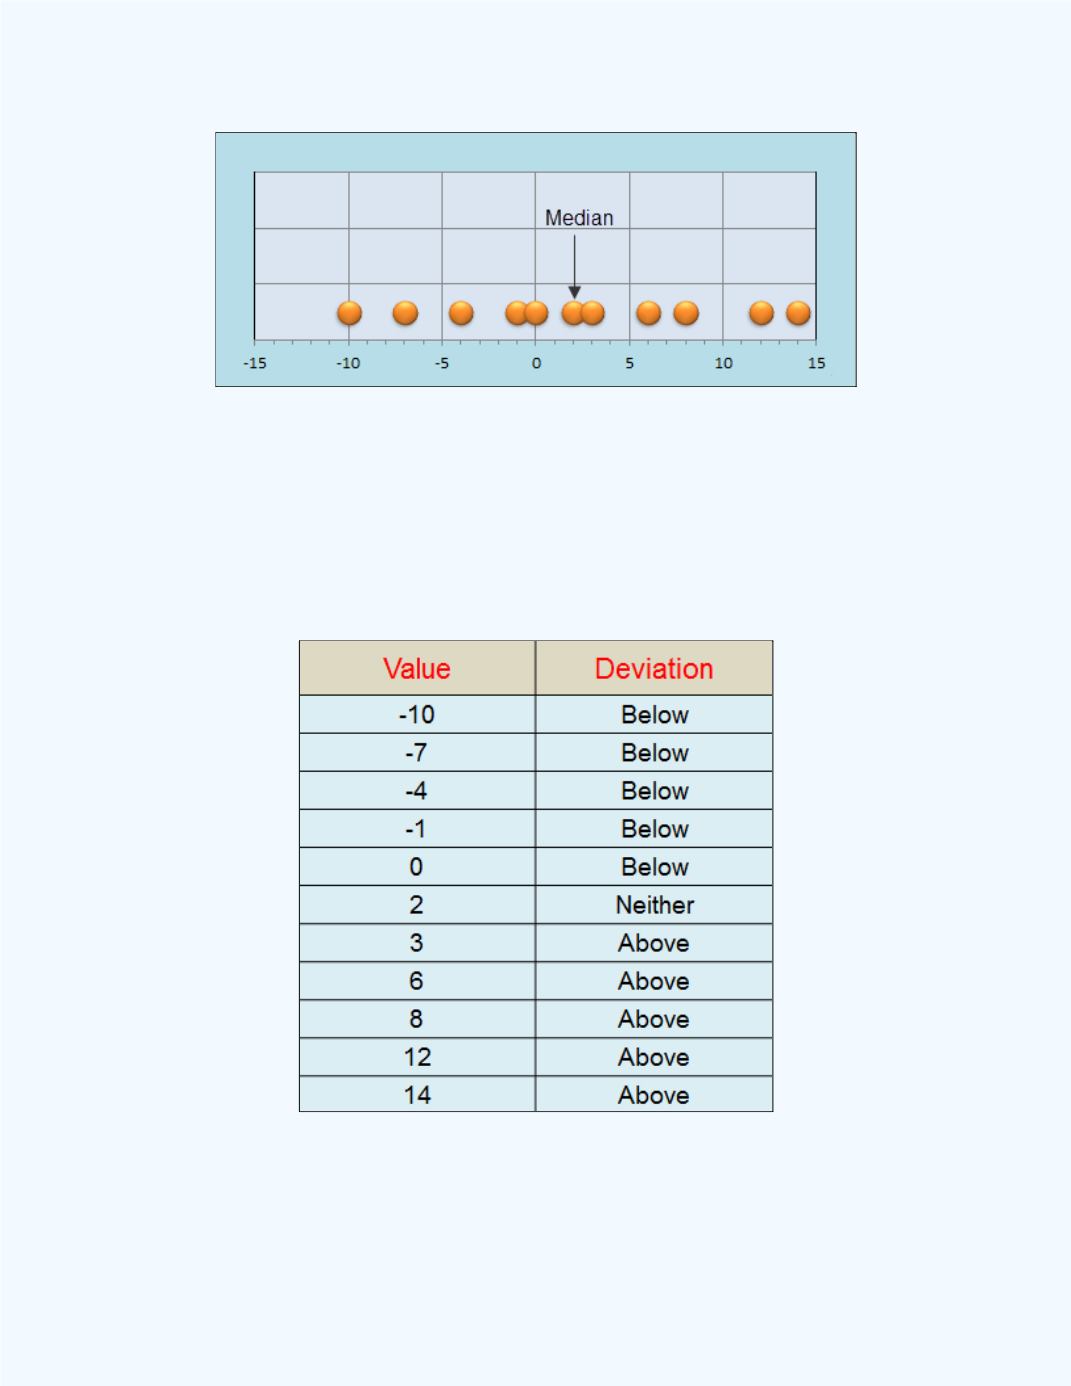
Figure 2- 9:
Plot of data points for
Example 2-3
A list of the values that are above the median or below the median are given
in
Table 2-2
.
Table 2-2:
List of Values that are Above
or Below the Median for
Example 2-3
When the values from above and below the median are pooled together, we
see that if the “balancing point” is the sample median, then the number of
values above the median balances (equals) the number of values below the
median. This is depicted in
Figure 2-10
. The figure shows how the median