


 75 / 762

Chapter 2: Measures of Central Tendency
75
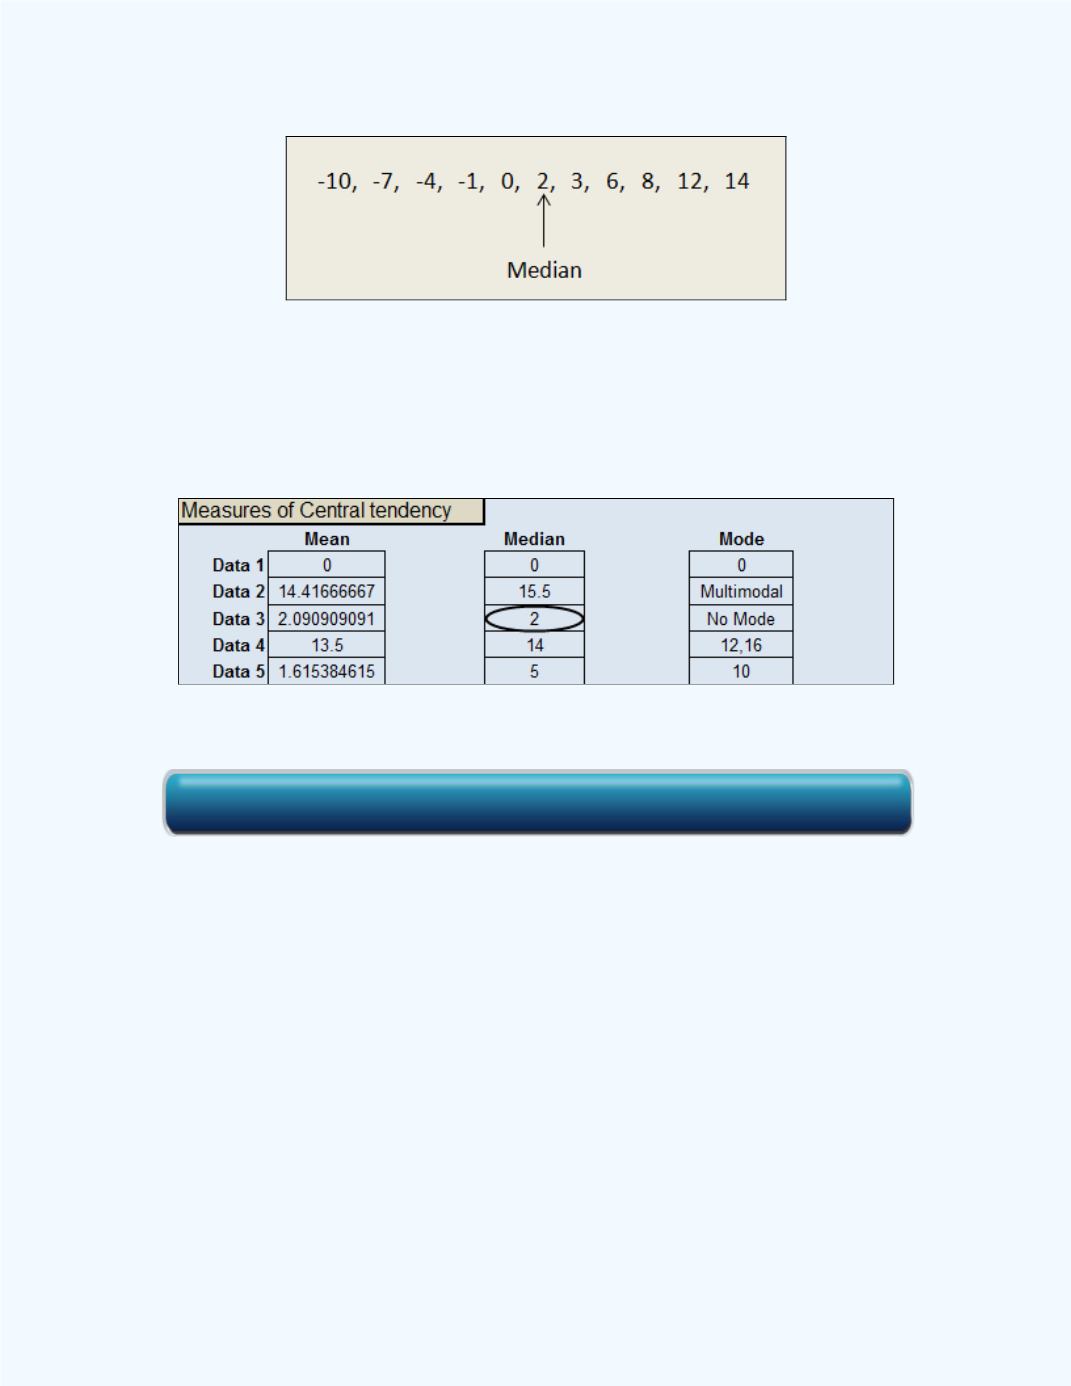
Figure 2-7:
Median for Data in
Example 2-3
We can also use the
Basic Statistics
workbook to find this median.
Figure
2-8
shows the same value of 2 for the median. The data was entered into the
Data 3 column in the workbook.
Figure 2-8:
Workbook output for the Median in
Example 2-3
Question:
Why does the middle number in an ordered data set
measure central tendency?
The following discussion will help us to answer this question.
Figure 2-9
shows a plot of the data points with the location of the sample median.
Click here for the Basic Statistics Workbook