


 77 / 762

Chapter 2: Measures of Central Tendency
77
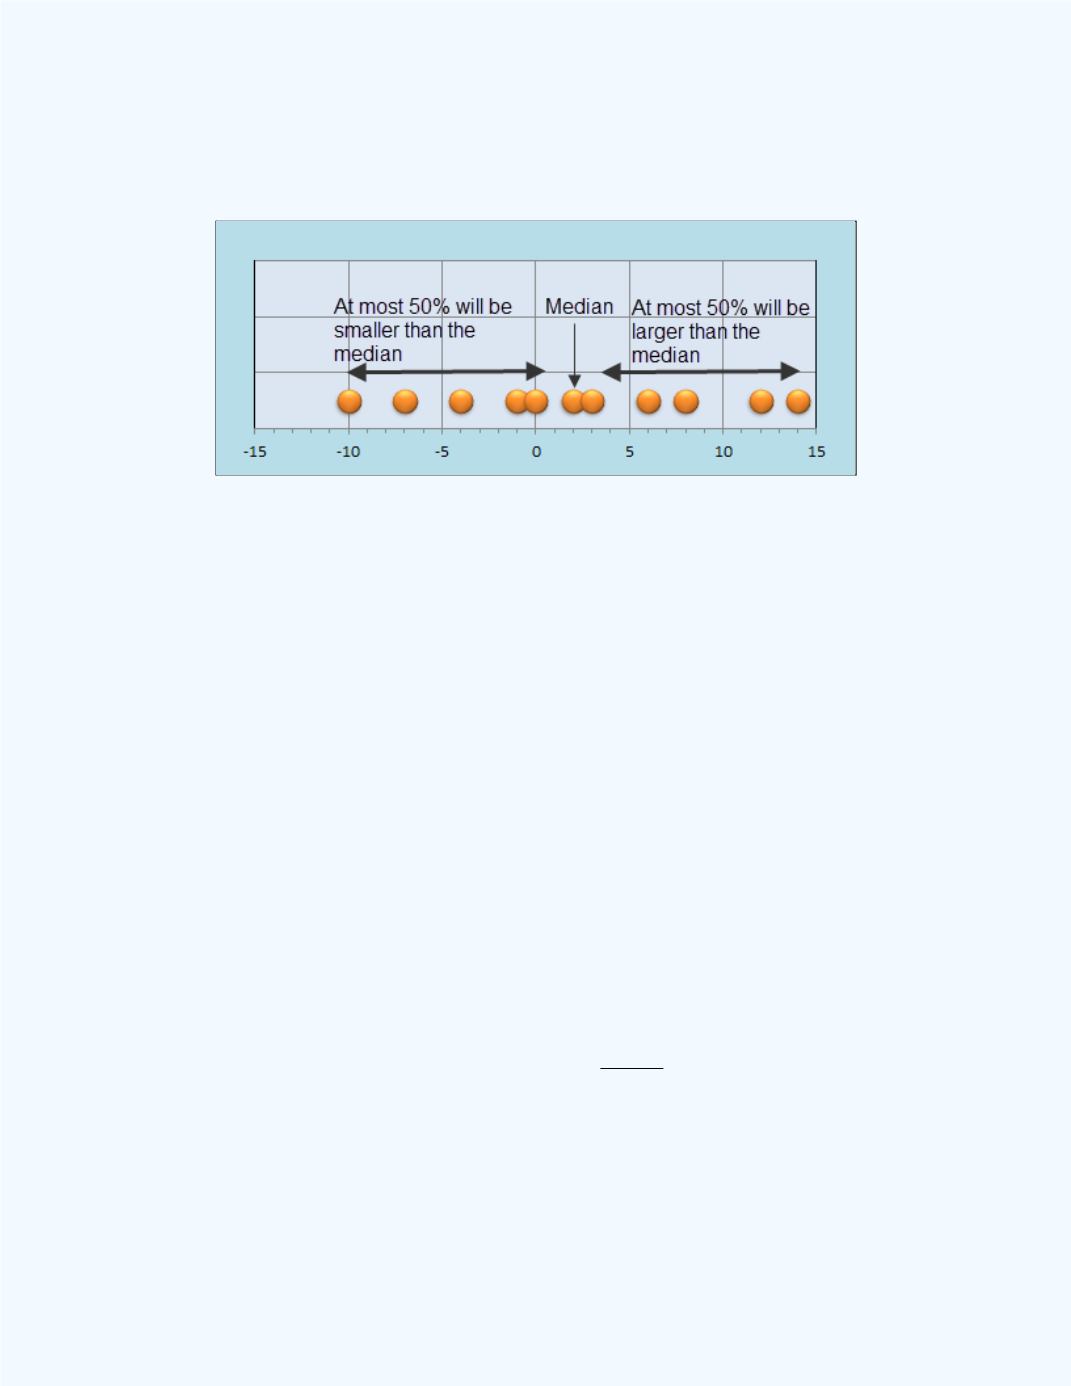
is the balancing point because at most 50% of the values are smaller than the
median and at most 50% of the values are larger the median.
Figure 2-10:
Median as a balancing point for data values
In
Example 2-3
Observe that there are the same number of values above the median as there
are below the median. This is why the median is considered as a measure of
central tendency.
Example 2-4:
Find the median for the ages of the following eight college
students:
23 19 32 25 26 22 24 20
Solution:
First, the values need to be placed in order. The ordered array
is given below:
19 20 22 23 24 25 26 32
Since this is an even number of ages, then the median will be the average of
the two middle numbers. Since the two middle numbers are located in the
fourth and fifth positions, then the median =
.5.23
2
24 23
The
Basic Statistics
workbook shows the same value of 23.5 for the median.
This is shown in
Figure 2-11
with the data entered in the Data 5 column in
the workbook.