


 83 / 762

Chapter 2: Measures of Central Tendency
83
2-17:
Illustration with two modes (bimodal)
Note:
If there are more than two modes we usually say that the data set is
multimodal
.
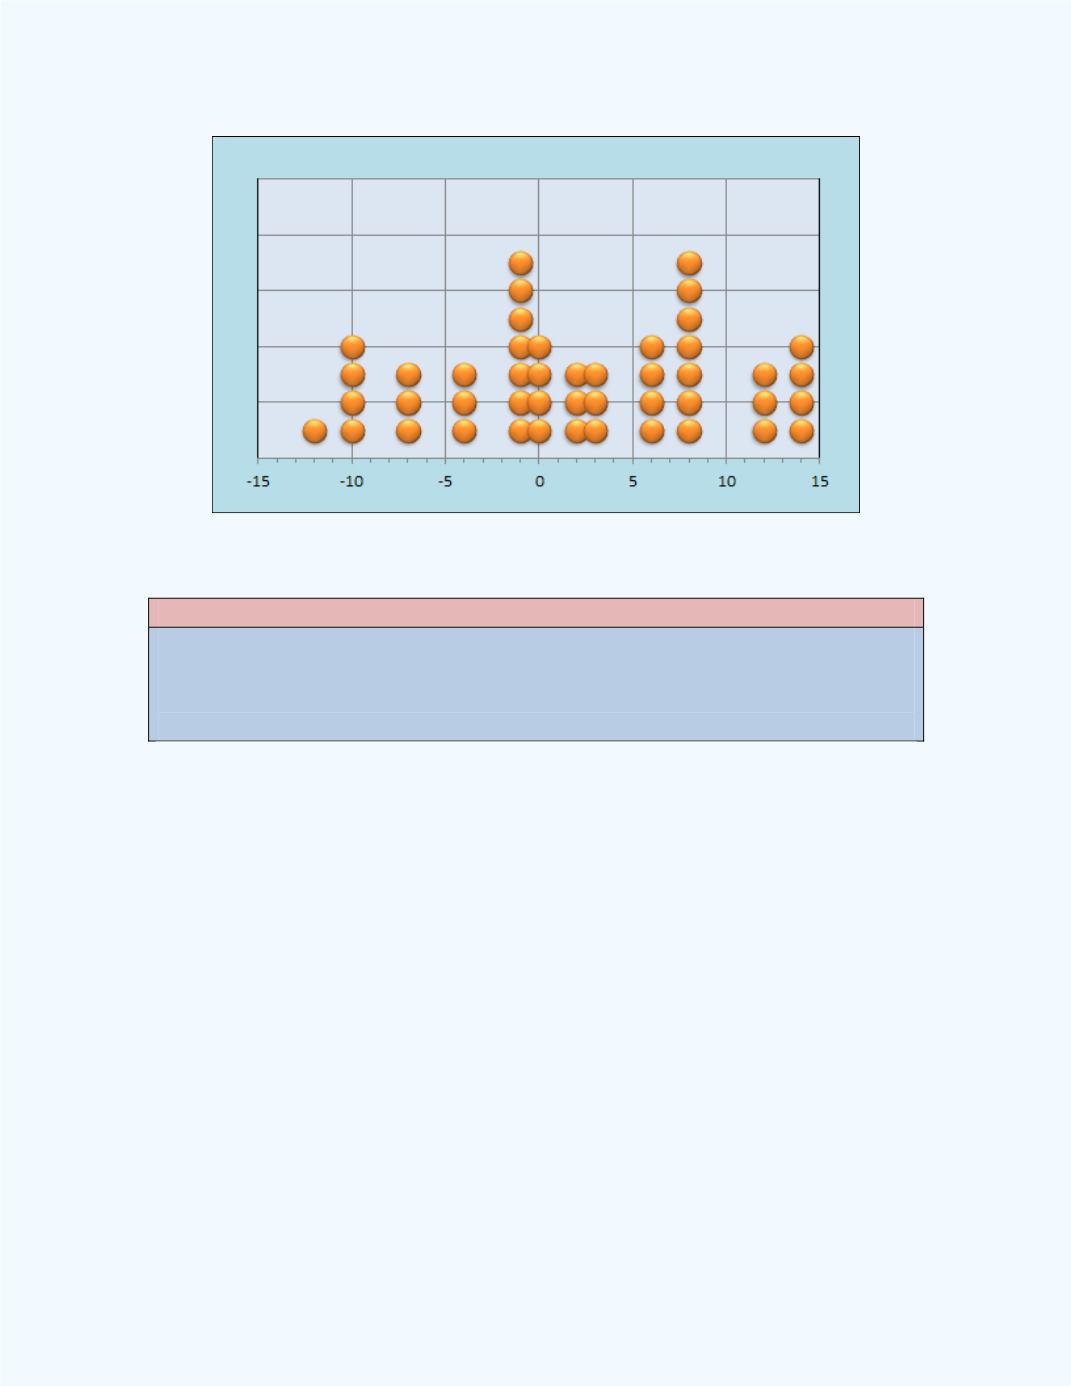
Figure 2-18
illustrates a case when a data set has three modes. Observe
that the highest frequency count of 7 is for the values of -10, -1 and 8. Since
there are three modes in the data set then in particular this is an example of a
multimodal distribution.