


 88 / 762

88
Chapter 2: Measures of Central Tendency
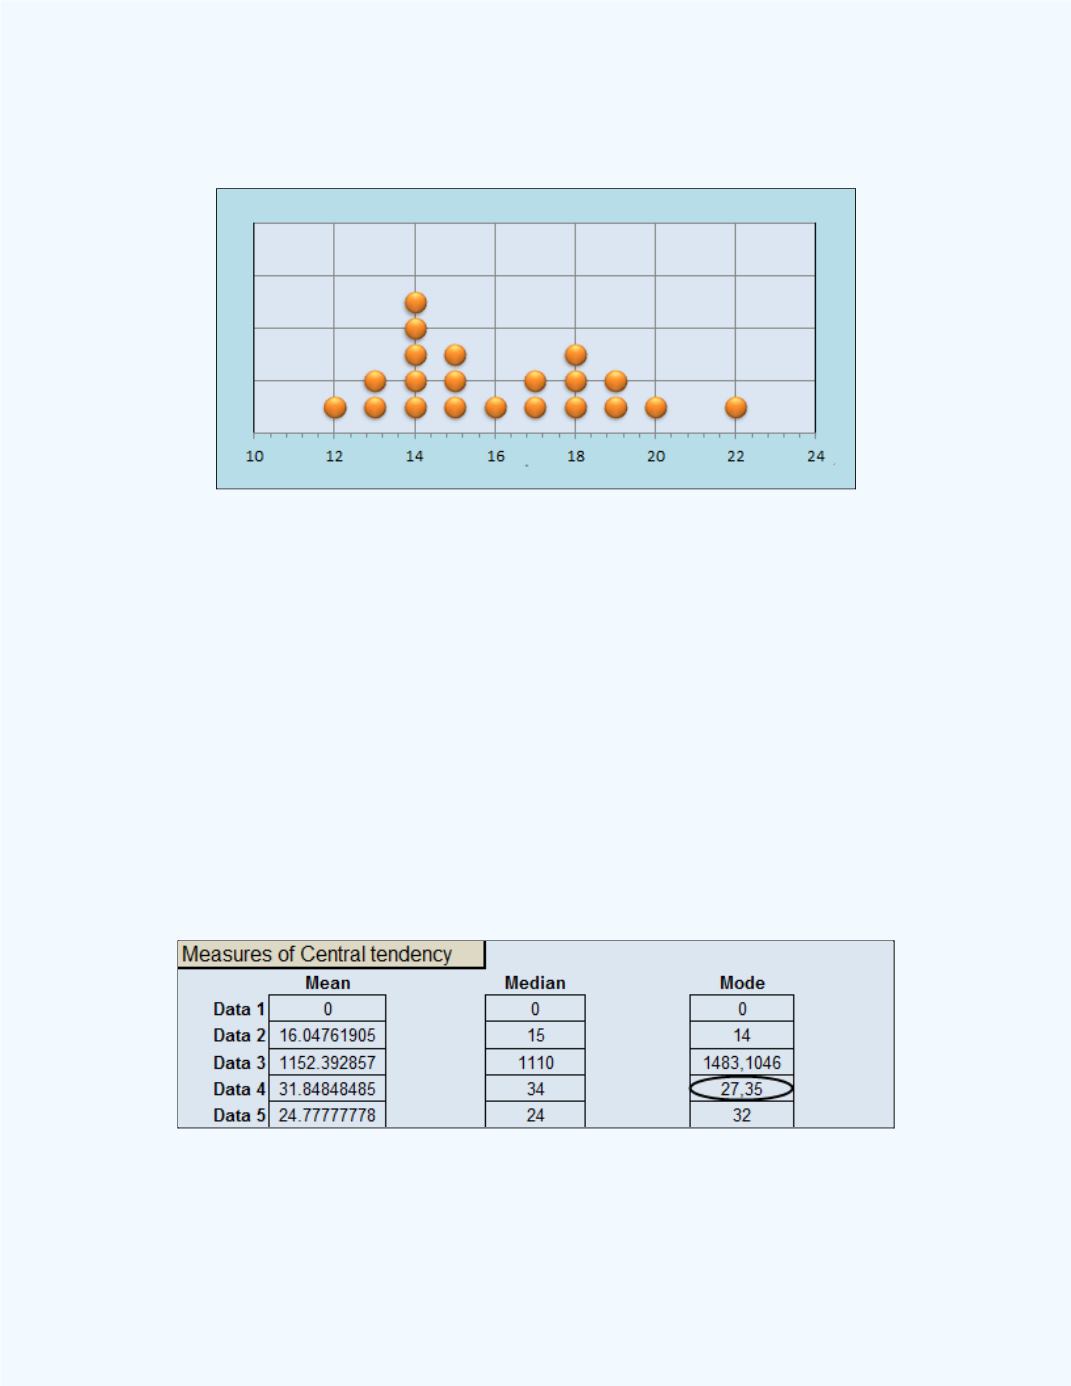
The dot plot in
Figure 2-26
supports the results in
Figure 2-25
.
Figure 2-26:
Dot Plot for
Example 2-90
Example 2-10:
A sample of the number of parking violation tickets issued
on a local campus by the campus police is given below. Find the mode for
the data set.
34 35 20 34 33 35 39 27 27 32 22
38 36 34 39 27 27 27 28 35 33 34
38 35 27 34 22 33 34 35 35 35 27
Solution:
We can use the
Basic Statistics
workbook to help in finding the
mode for the data set.
Figure 2-27
shows the output. Data was entered in
the Data 4 column. Observe that there are two modes whose values are 27
and 35.
Figure 2-27:
Basic Statistics Output for
Example 2-10