


 90 / 762

90
Chapter 2: Measures of Central Tendency
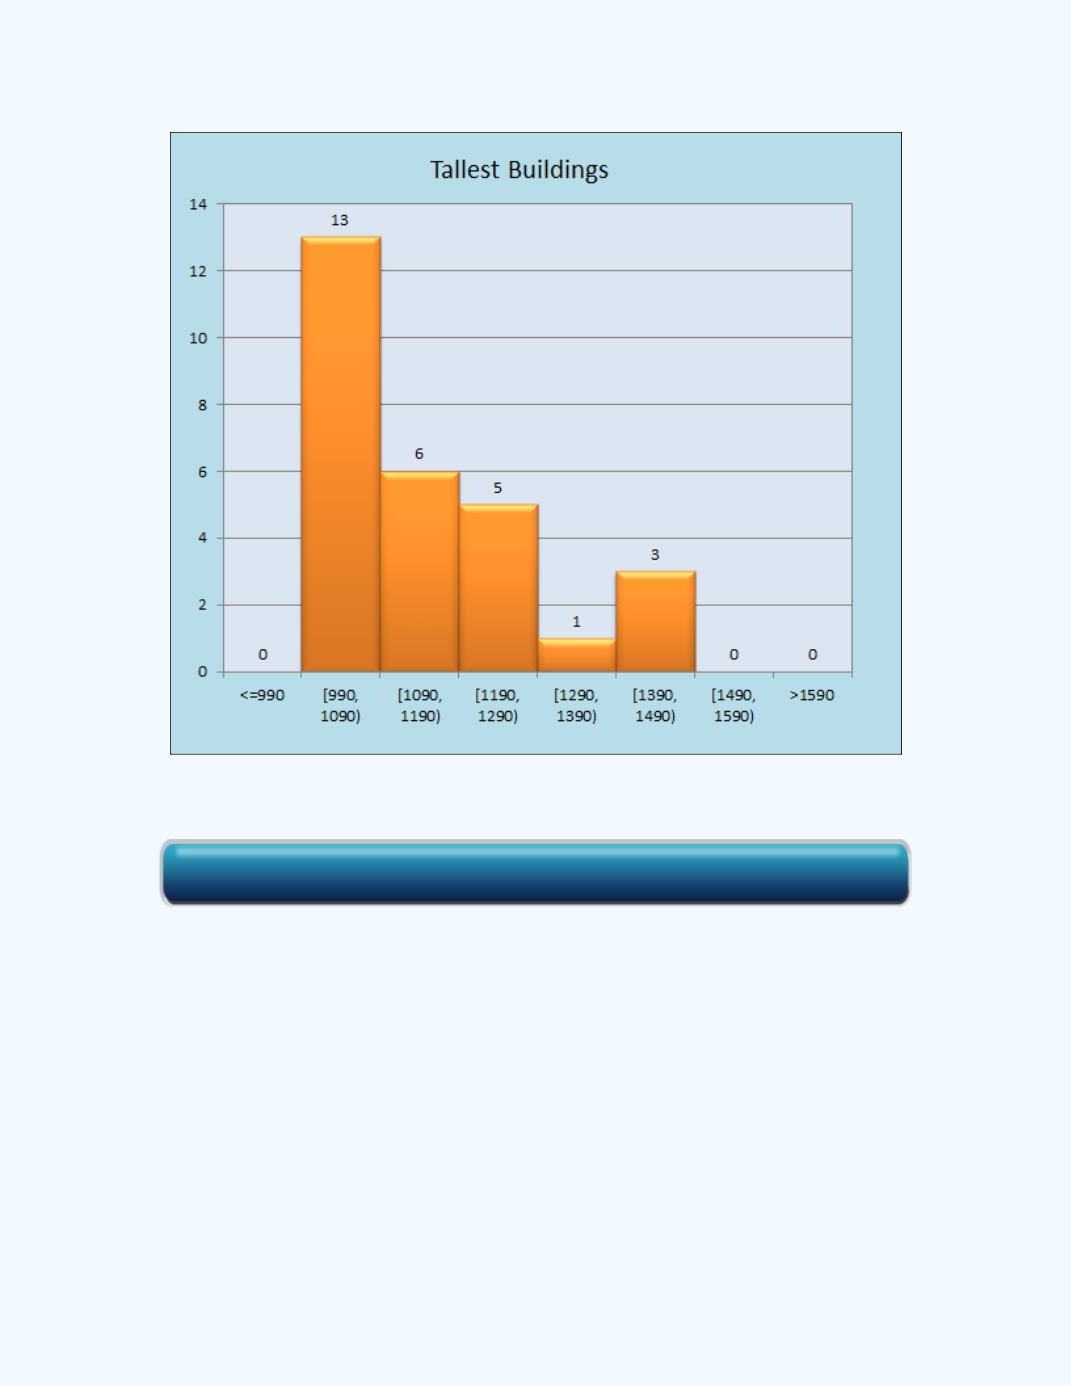
Figure 2-29:
H
istogram for the data given in
Example 2-5
Recall, this chapter deals with measures of central tendency. So how can we
use the mode as a measure of central tendency? Ideally, the mode can be
used as a measure of central tendency when the data set is unimodal and
symmetrical.
Figure 2-30
shows a set of symmetrical data which is
unimodal. Observe that the mode is right in the center. There is a single
mode. In this case the mode can be used as a measure of central tendency.
If the data is not symmetrical, one should use the median as the ideal
measure of central tendency for the data set. The median is not influenced
by outliers. The mean, however, is influenced by outliers.
Click here for Histogram from Raw Data Workbook