


 92 / 762

92
Chapter 2: Measures of Central Tendency
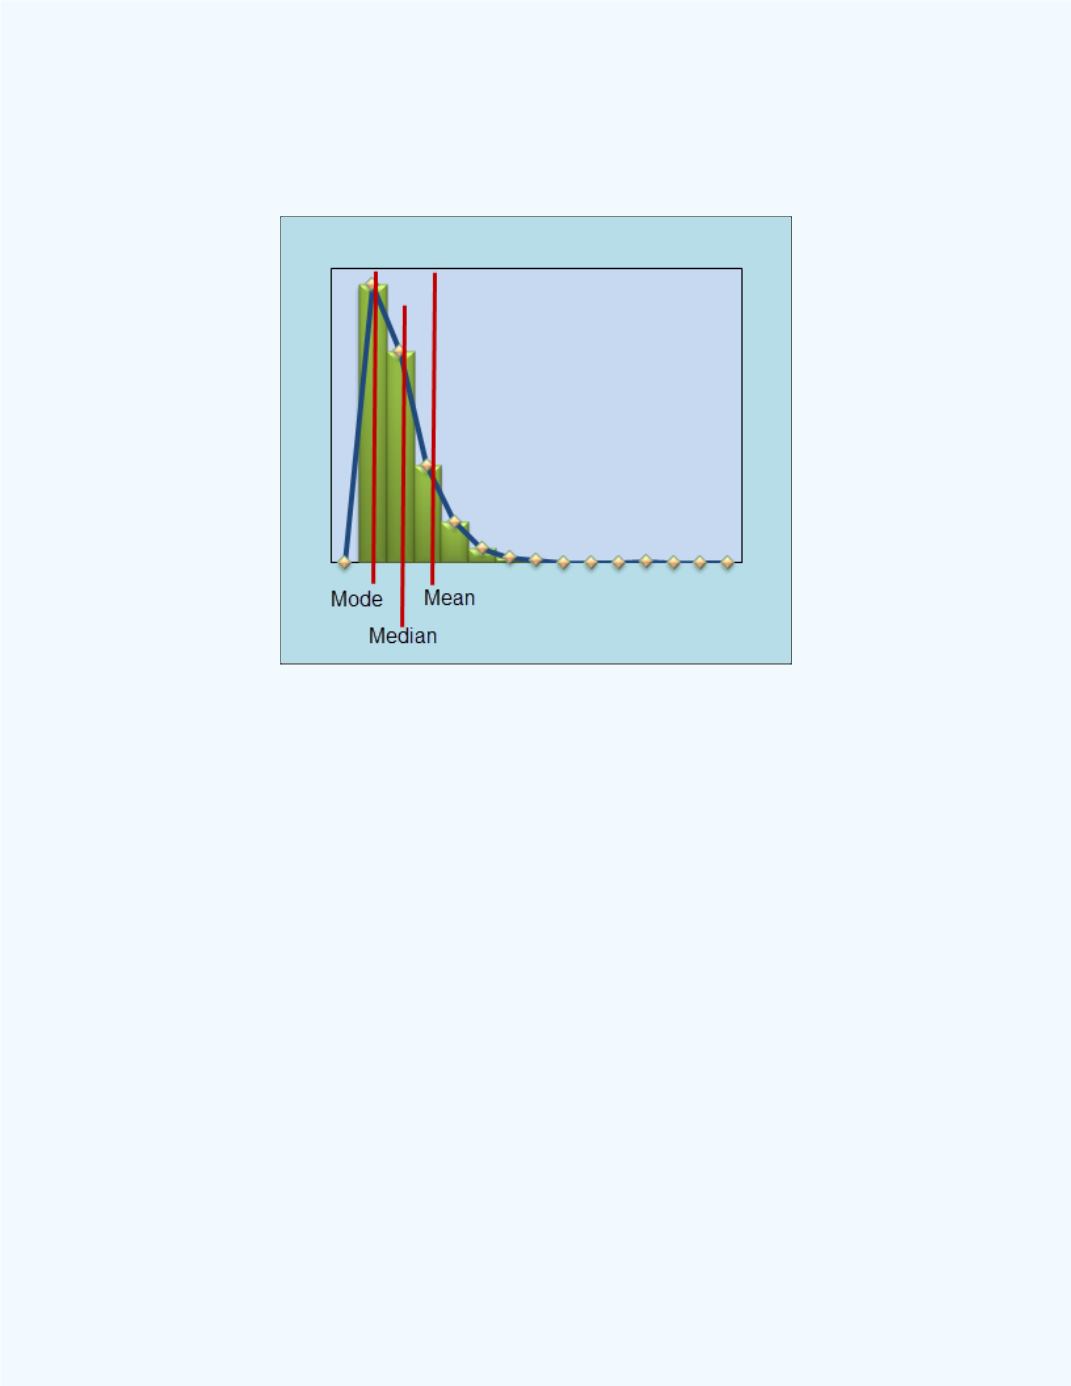
That is, for a postively skewed distribution : Mode < Median < Mean.
These properties are depicted in
Figure 2-31
.
Figure 2-31:
Positively Skewed Distribution
(Mode < Median < Mean)
Next we will discuss negatively skewed distributions.
Negatively Skewed Distribution
In a negatively skewed distribution, most of the data values fall to the right
of the mean, and the “tail” of the distribution is to the left. In addition, the
mean is to the left of the median and the mode is to the right of the median.
That is, for a negatively skewed distribution : Mean < Median < Mode.
These properties are depicted in
Figure 2-32
.