


 87 / 762

Chapter 2: Measures of Central Tendency
87
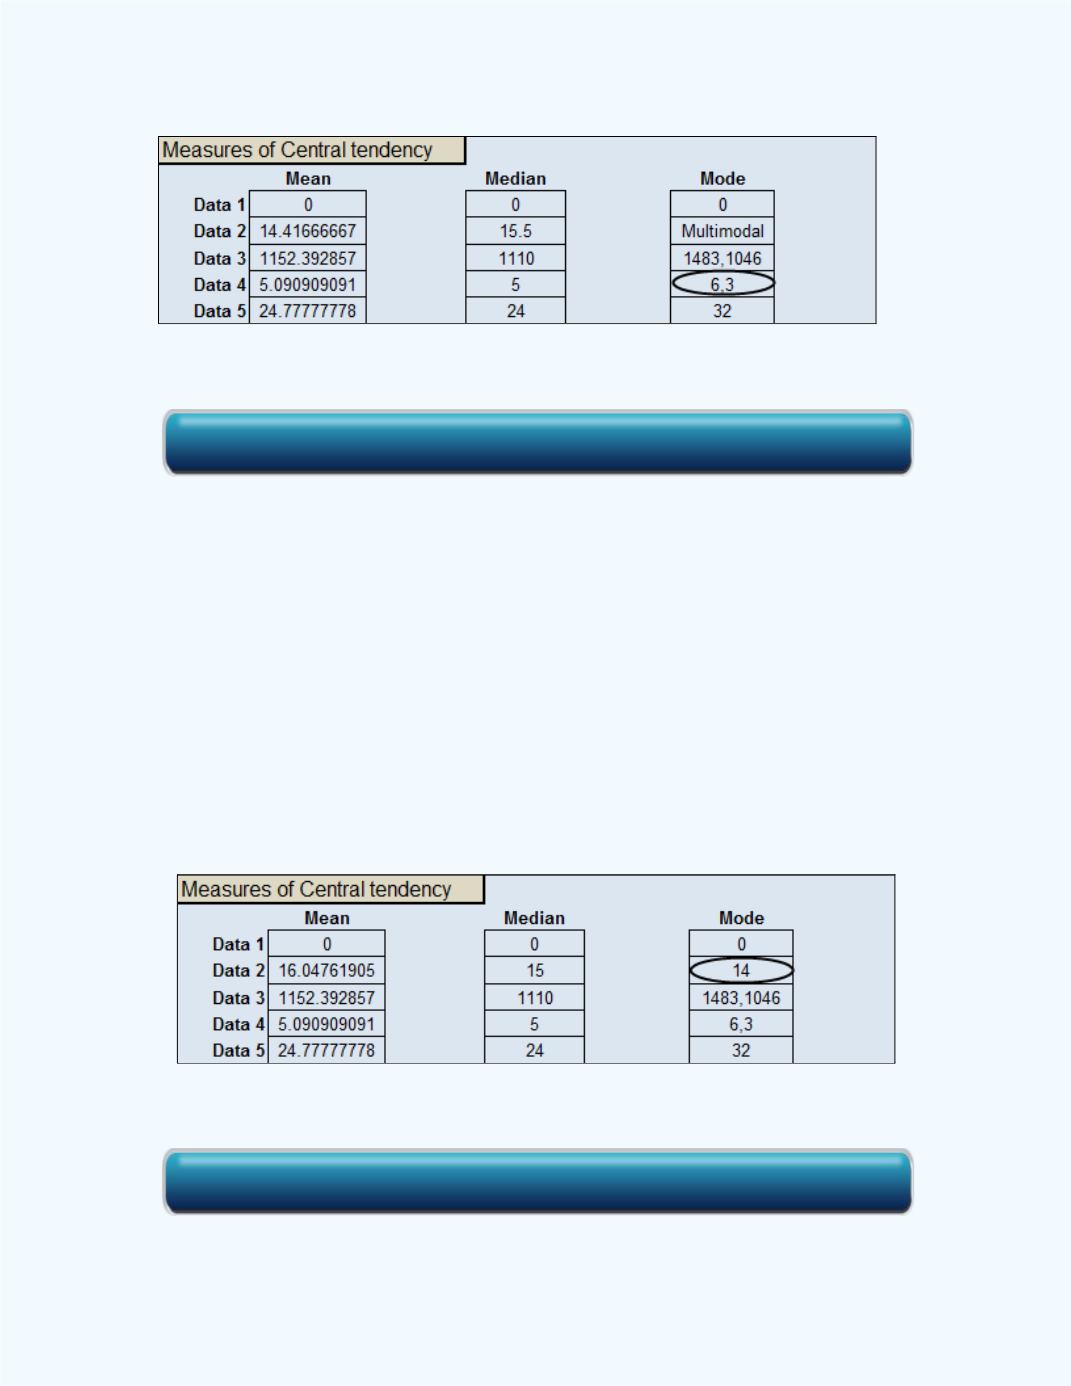
Figure 2-24:
Basic Statistics Output for
Example 2-8
Example 2-9:
The number of oil changes recorded by a local service
station over a three week period is given below. Find the mode for the data
set.
Note:
the service station is open for business seven days each week.
14 15 20 14 13 15 19 12 22 18 16
14 19 17 17 18 15 13 14 18 14
We can use the
Basic Statistics
workbook to help in finding the mode for
the data set. The value of the mode is equal to 14. This shown in
Figure 2-25
. The data set was entered in the Data 2 column.
Observe that this is a unimodal data set.
Figure 2-25:
Basic Statistics Output for
Example 2-9
Click here for the Basic Statistics Workbook Click here for the Basic Statistics Workbook