


 85 / 762

Chapter 2: Measures of Central Tendency
85
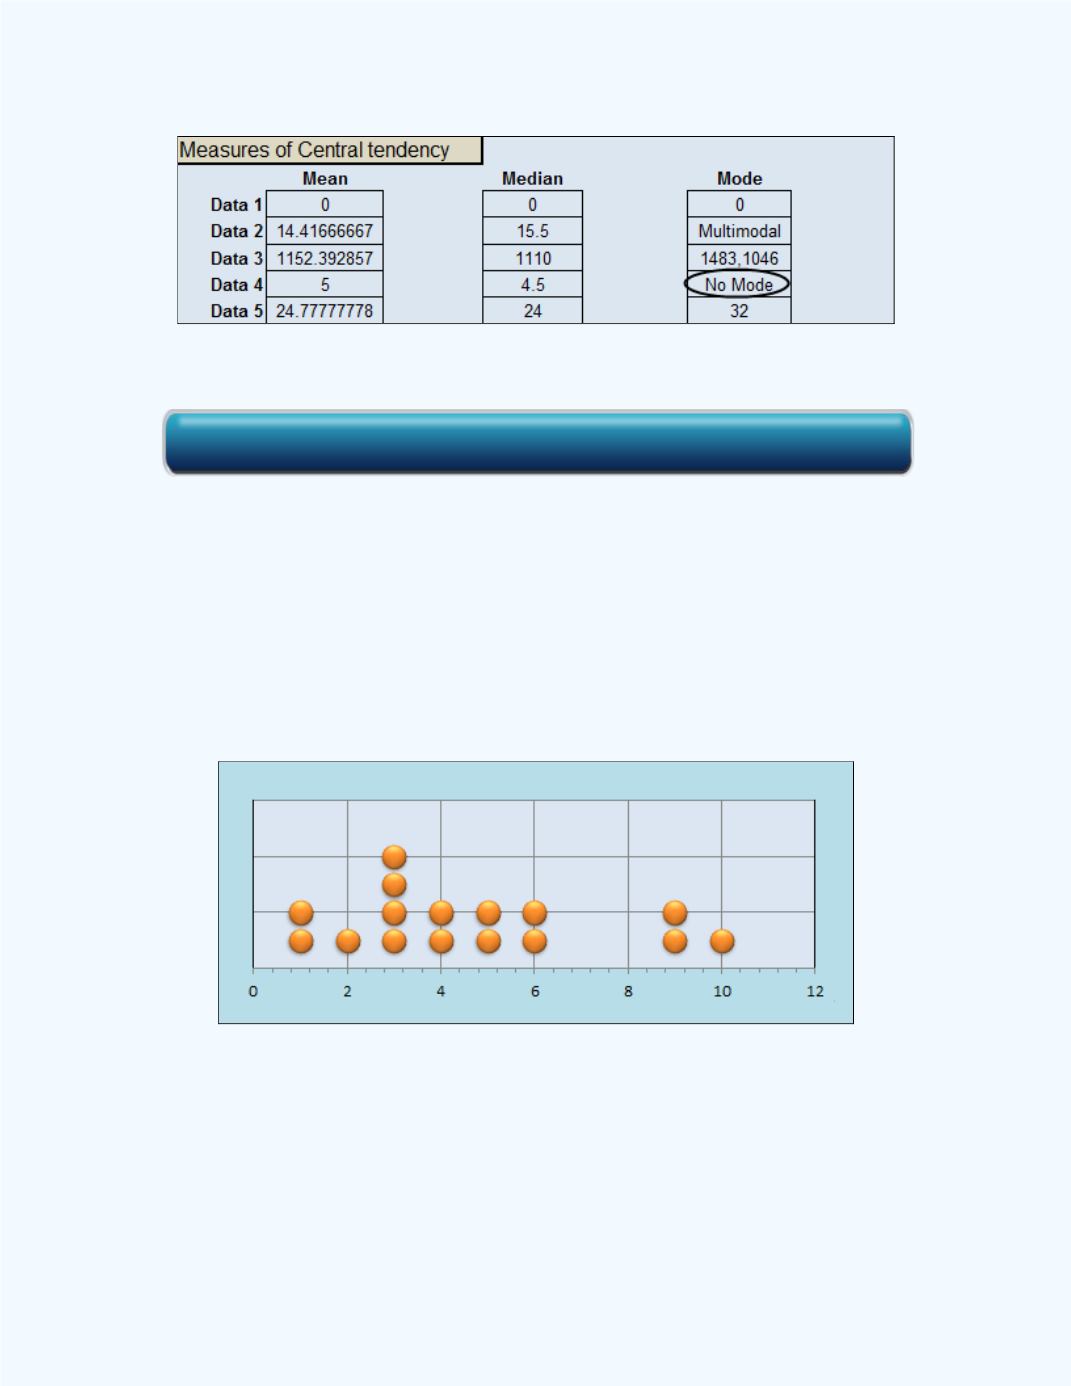
Figure 2-20:
Basic Statistics Output for
Example 2-6
Example 2-7:
What is the mode for the given sample values?
3 5 1 4 2 9 6 10 5 3 4 3 9 3 6 1
Solution:
We see from
Figure 2-21
that one of the values occurs with the
highest frequency of 4. Thus, the data set has one mode
Figure 2-21
shows
a plot of the data values. Observe that the value of 3 occurs with the highest
frequency. Thus, the value of the mode is 3, and this data set is unimodal.
Figure 2-21:
Dot Plot
for
Example 2-7
Figure 2-22
shows the
Basic Statistics
workbook output for
Example 2-7
.
Observe that the display indicates that the value of the mode is 3. The data
set was entered in the Data 4 column.
Click here for the Basic Statistics Workbook