


 82 / 762

82
Chapter 2: Measures of Central Tendency
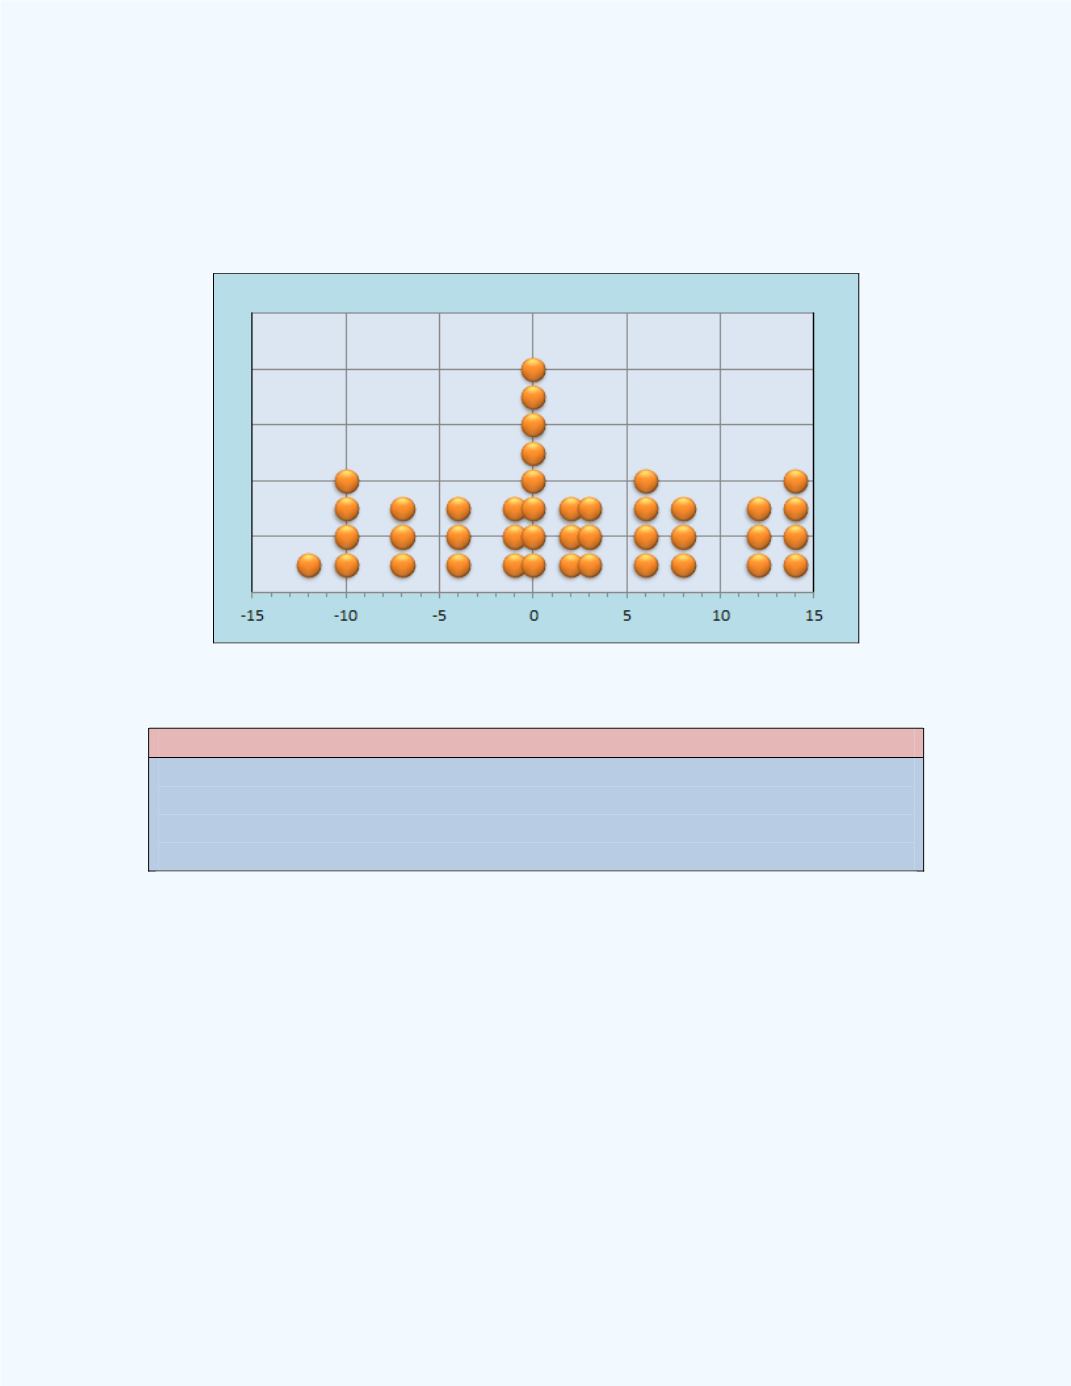
Figure 2-16
illustrates a case when a data set has a single mode. Observe
that the highest frequency count is for the value of 0. Thus this is an
example of a unimodal data set. Note also that the data set in
Figure 2-15
is
also a unimodal data set.
Figure 2-16:
Illustration with a single mode (unimodal)
Note:
If two elements in the dataset are tied for the highest frequency of
occurrences, then the data set is said to be
bimodal
.
Figure 2-17
illustrates a case when a data set has two modes. Observe that
the highest frequency count of 7 is for the values of -1 and 8. Thus this is an
example of a bimodal data set.