


 86 / 762

86
Chapter 2: Measures of Central Tendency
Figure 2-22:
Basic Statistics Output for
Example 2-7
Example 2-8:
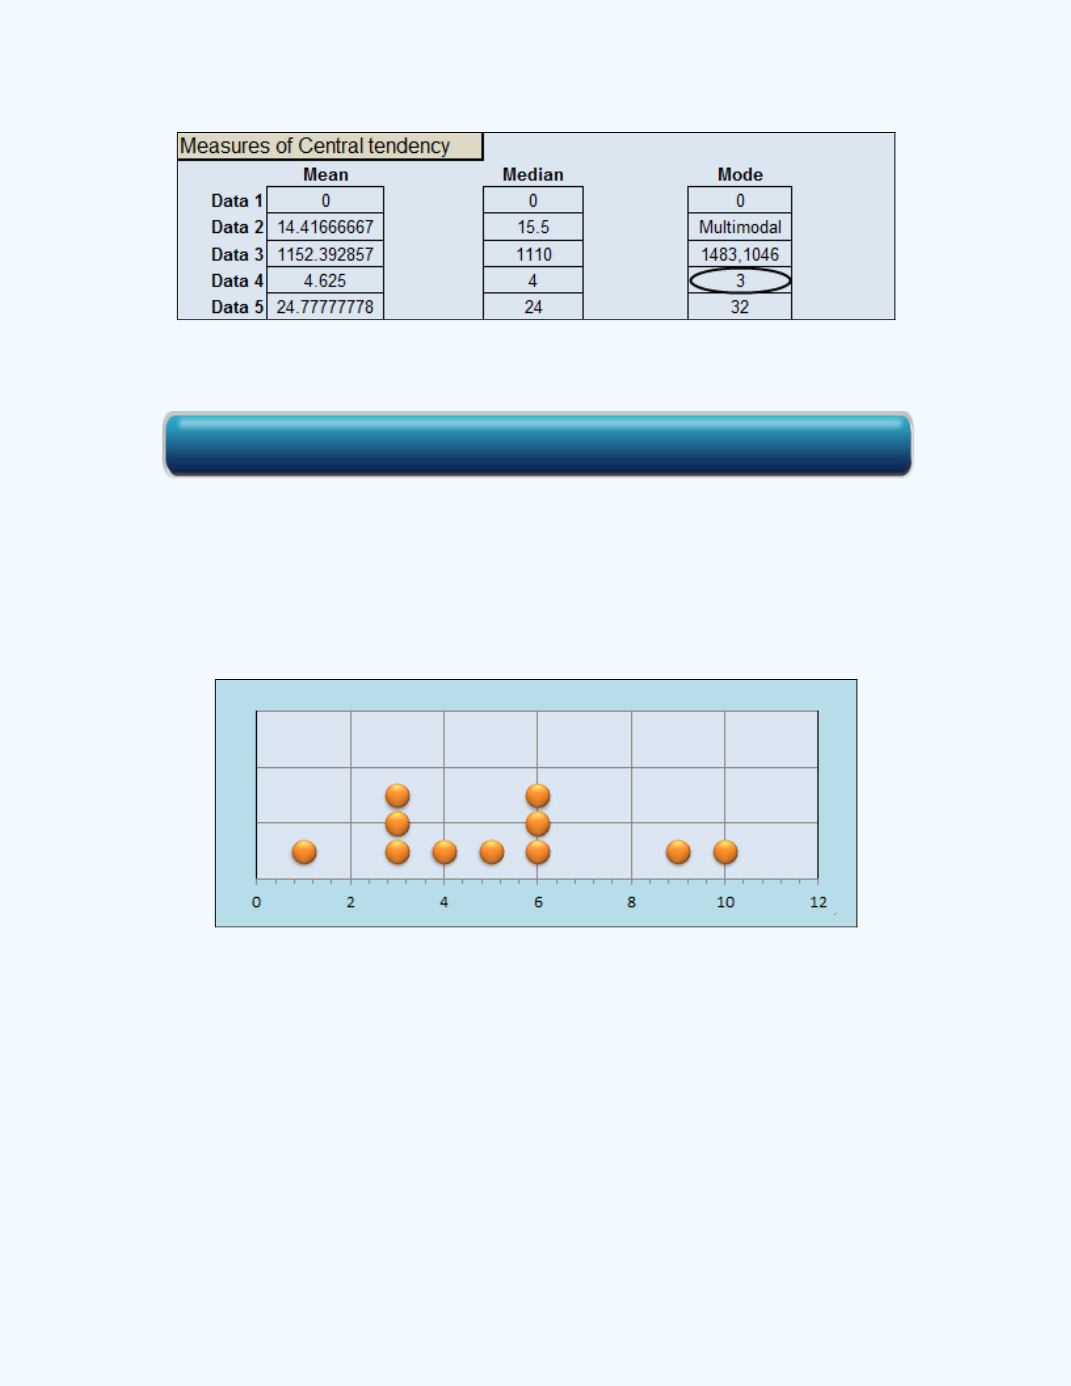
What is the mode for the following sample values?
6 10 5 3 4 3 9 3 6 1 6
Solution:
Figure 2-23
shows a plot of the data values.
Figure 2-23:
Dot Plot
for
Example 2-8
Observe that the value of 3 and the value of 6 occur with the highest but
equal frequency. Thus, the values of the mode are 3 and 6, and this data set
is bimodal.
Figure 2-24
shows the
Basic Statistics
workbook output for
Example 2-8
.
Observe that display indicates that there are two modes whose values are 3
and 6. The data set was entered in the Data 4 column.
Click here for the Basic Statistics Workbook