


 84 / 762

84
Chapter 2: Measures of Central Tendency
Figure 2-18:
Illustration with three modes (multimodal)
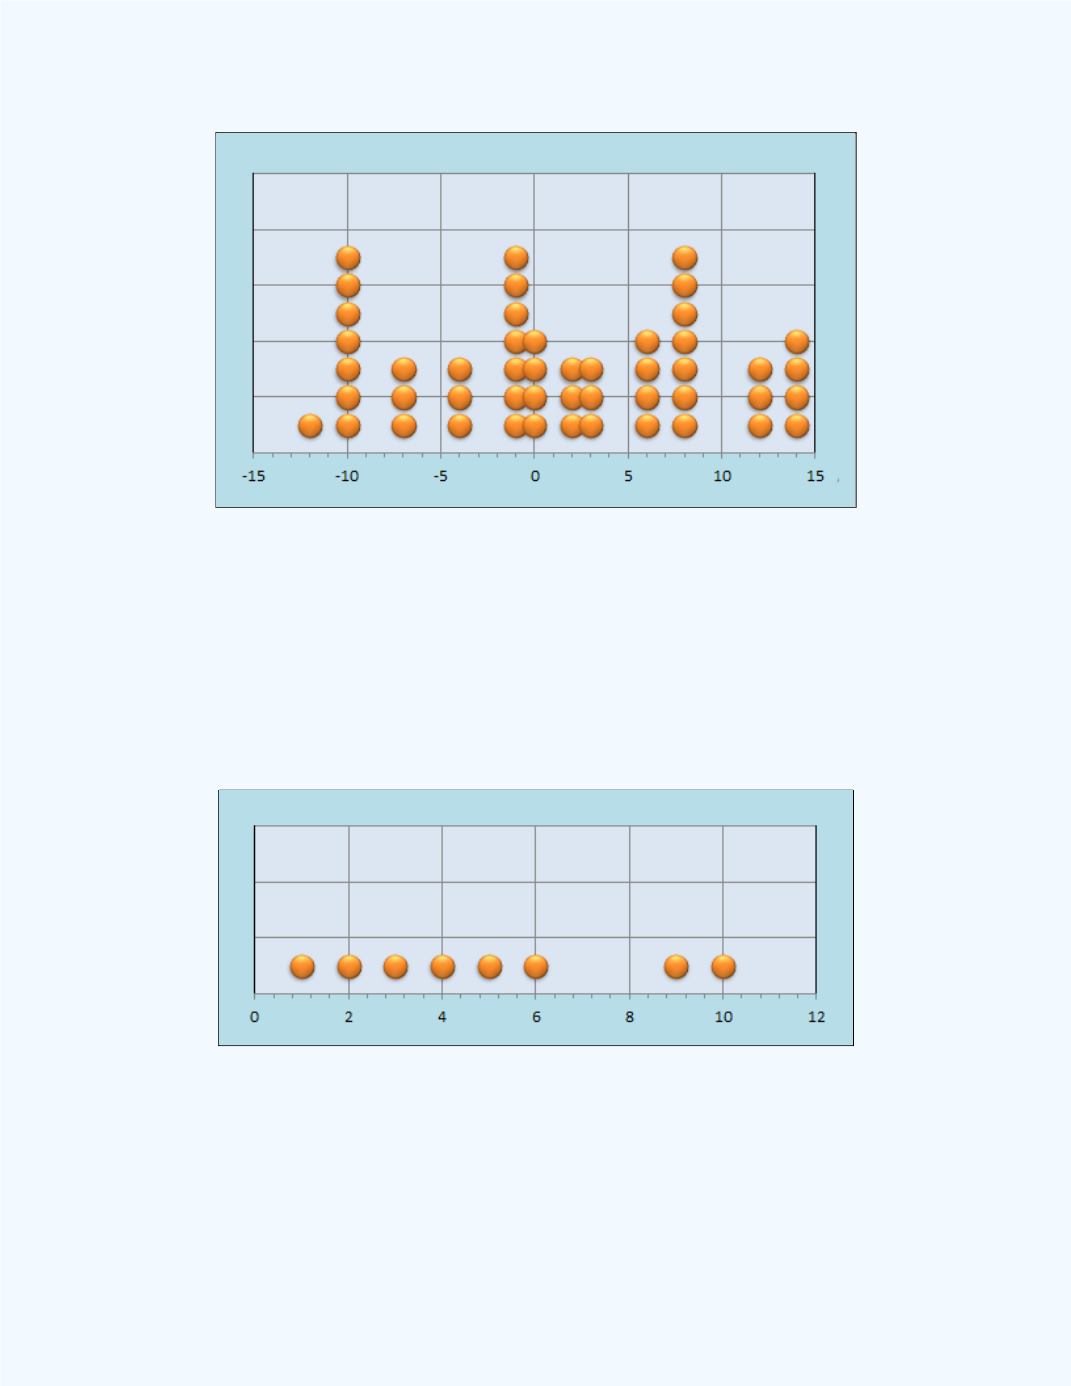
Example 2-6:
What is the mode for the following sample values?
3 5 1 4 2 9 6 10
Solution:
We see from
Figure 2-19
that each value occurs with a
frequency of one. Thus, the data set has no mode.
2-19:
Plot of data values for
Example 2-6
Figure 2-20
shows the
Basic Statistics
workbook output for
Example 2-6
.
Observe that display indicates that there is no mode for the data se. The data
set was entered in the Data 4 column.