


 78 / 762

78
Chapter 2: Measures of Central Tendency
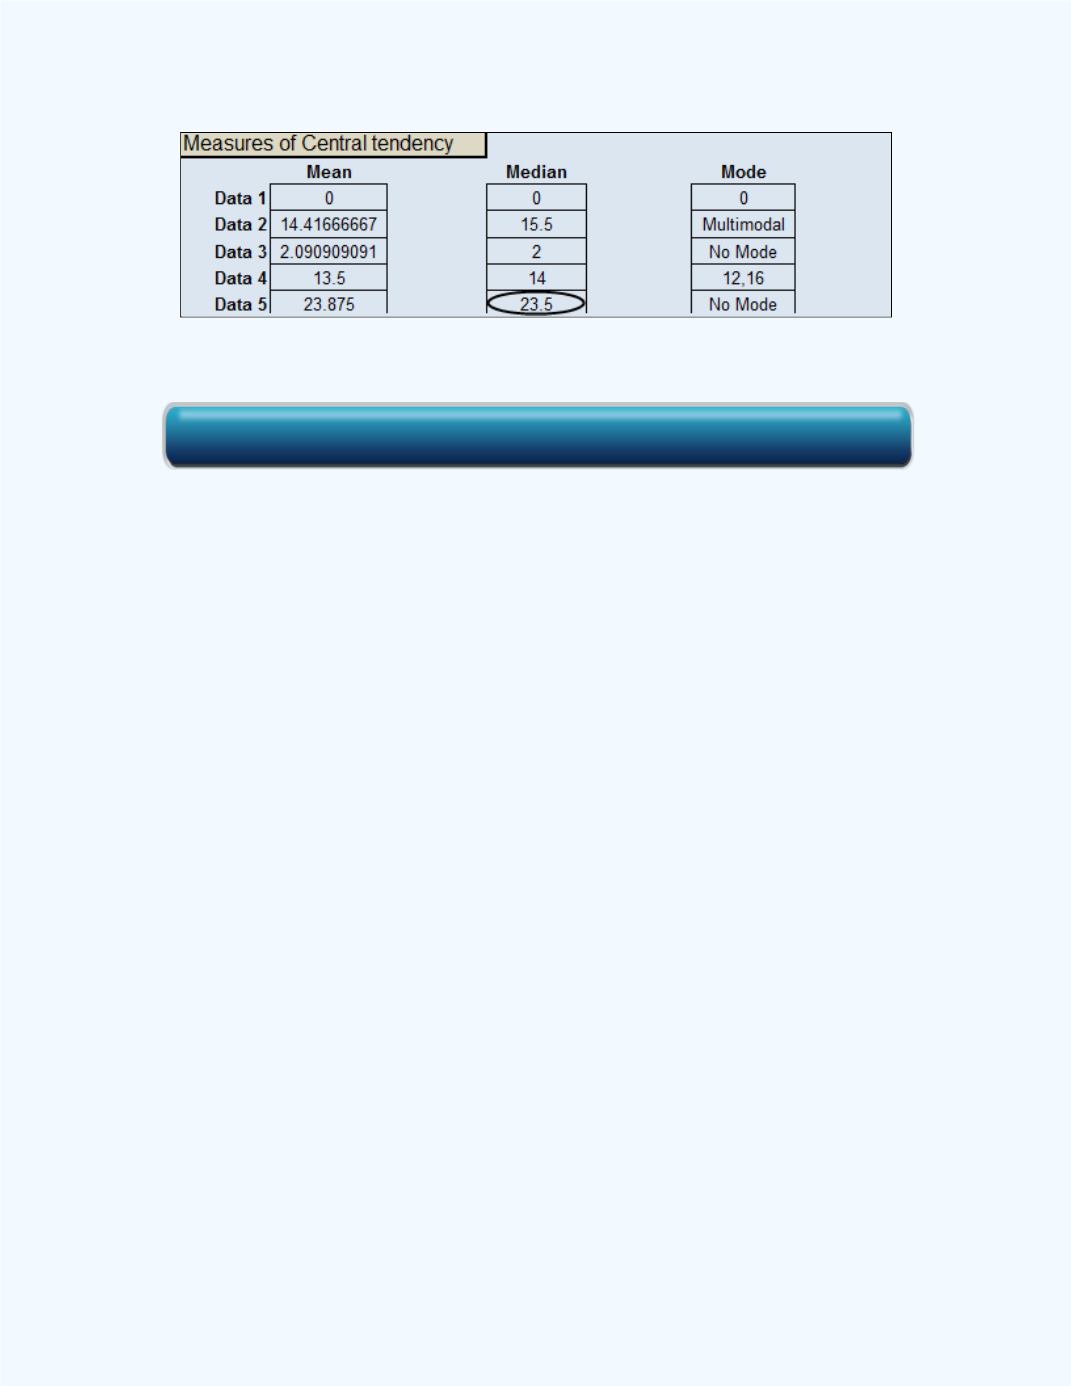
Figure 2-11:
Workbook output for the Median in
Example 2-4
Example 2-5:
The heights of 28 tallest buildings in the world are given
below (units of feet).
1483, 1483, 1451, 1362, 1283, 1260, 1250, 1227, 1205, 1165, 1140, 1136,
1135, 1127, 1093, 1087, 1083, 1058, 1053, 1046, 1046, 1039, 1018, 1017,
1014, 1007, 1002, 997
Find the median height for these buildings.
Solution:
The heights are already in descending order, so we need not
order them. Since there is an even number of building heights in the
sample, the median will be the average of the two middle values. The two
middle numbers will be located at the 14
th
and 15
th
positions in the given
ordered set.
Thus, the median = (1127 + 1093)/2 = 1110 ft.
Using the
Basic Statistics
workbook shows the same value of 1110 for the
median. This is shown in
Figure 2-12
with the data entered in the Data 3
column in the workbook.
Click here for the Basic Statistics Workbook