


 70 / 762

70
Chapter 2: Measures of Central Tendency
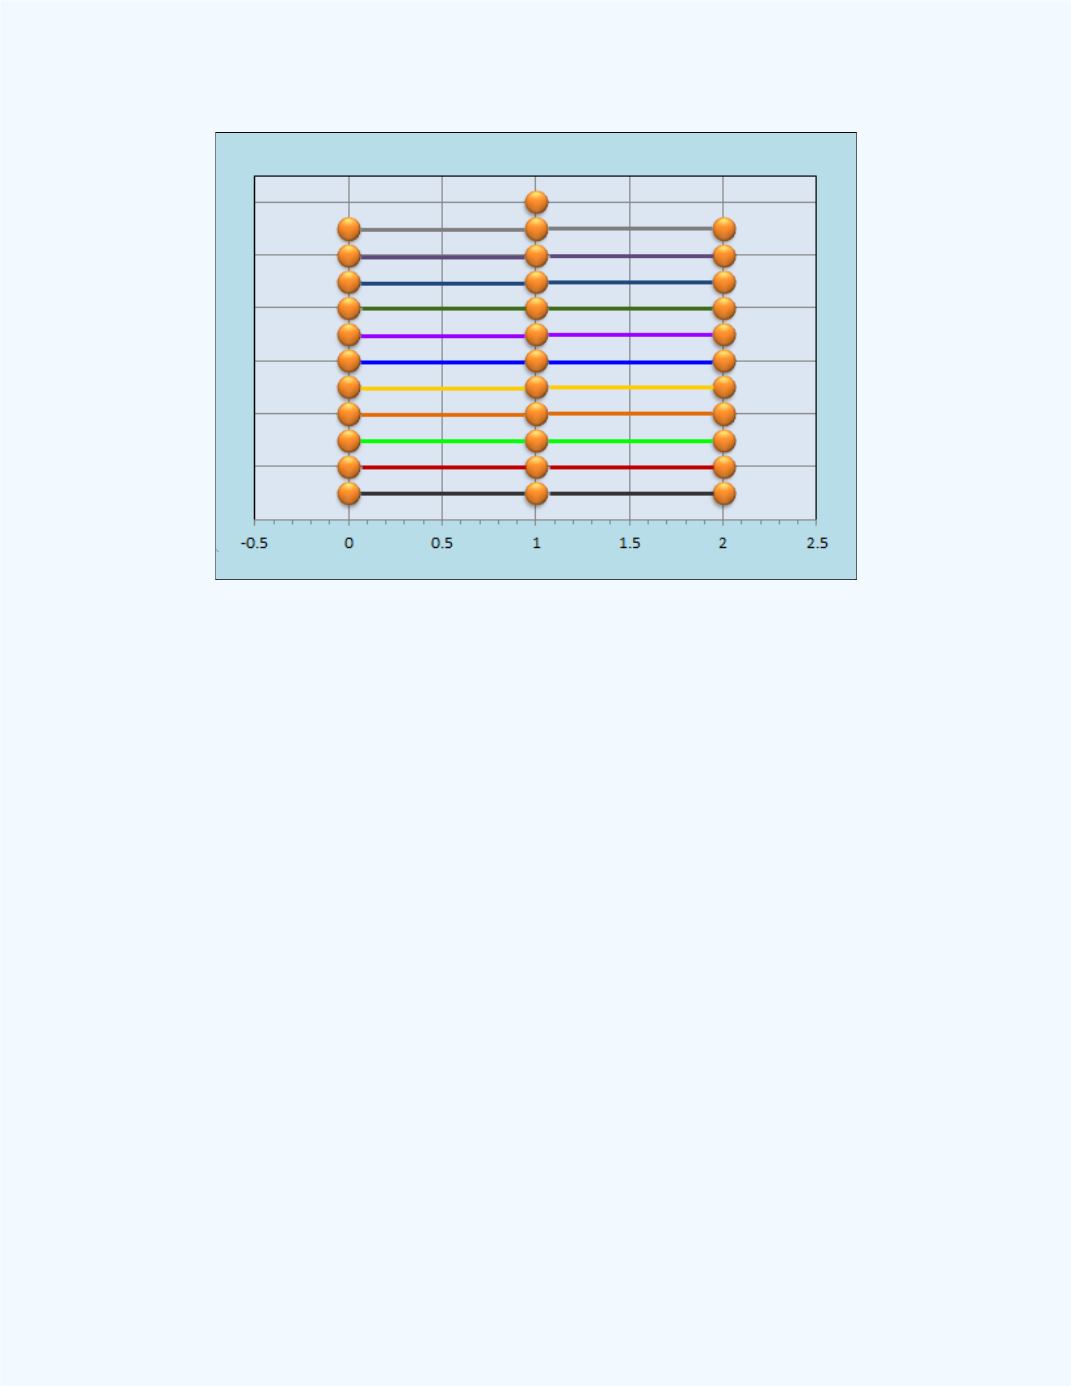
Figure 2-4:
Deviations from the sample mean for
Example 2-1
Observe that the deviations are both negative and positive in values. The
deviations were color coded in
Figure 2-4
in order to identify the different
deviations. Also observe from the figure that colors were matched and with
equal lengths for the positive and negative deviations since the absolute
values were the same for each deviation.
When the deviations from the left and the right of the sample mean are
added together, disregarding the sign of the values, we see that when the
“balancing point” is the sample mean, then these sums will be equal in
absolute values. Here in
Example 2-1
, the sum of the deviations to the right
of the mean is 11. The sum of the deviations to the left of the mean is –11.
However, we will use the absolute value of these negative deviations. That
is, we use +11. This is depicted in
Figure 2-5
.