


 68 / 762

68
Chapter 2: Measures of Central Tendency
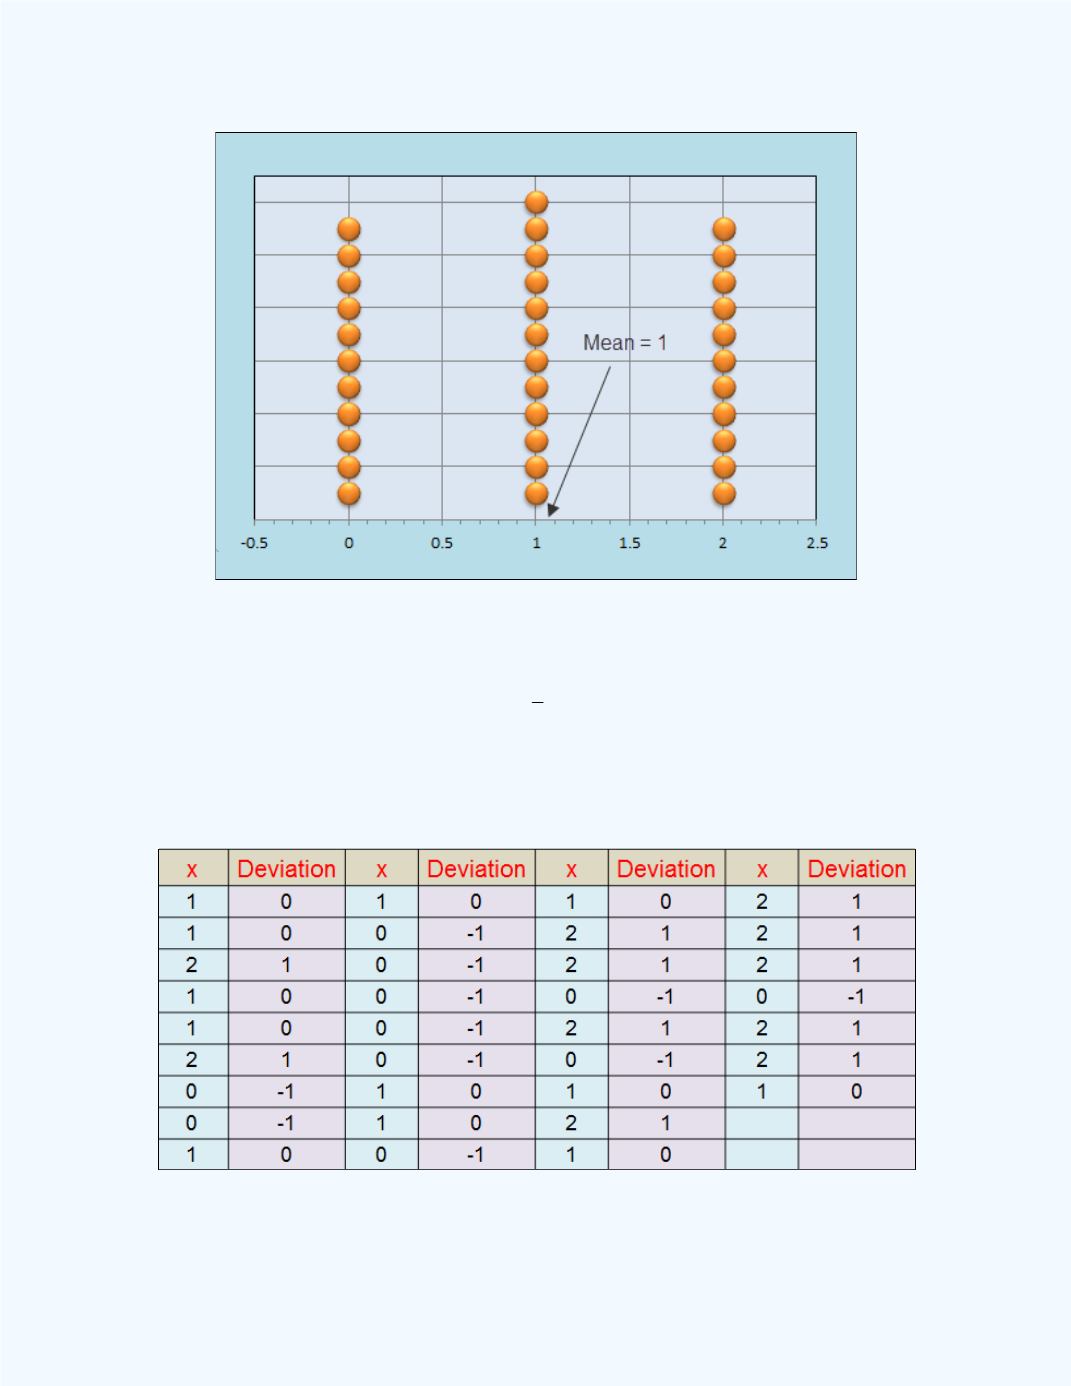
Figure 2-2:
Dot Plot of data values for
Example 2-1
Next, we compute the deviation from the sample mean of 1.0 for each value
in the data set. That is, compute
x x
for each value
x
. These deviations
are given in the
Table 2-1
.
Table 2-1:
Deviations from the Mean for Values in
Example 2-1
If we sum all the deviations we will get a value of 0.