


 71 / 762

Chapter 2: Measures of Central Tendency
71
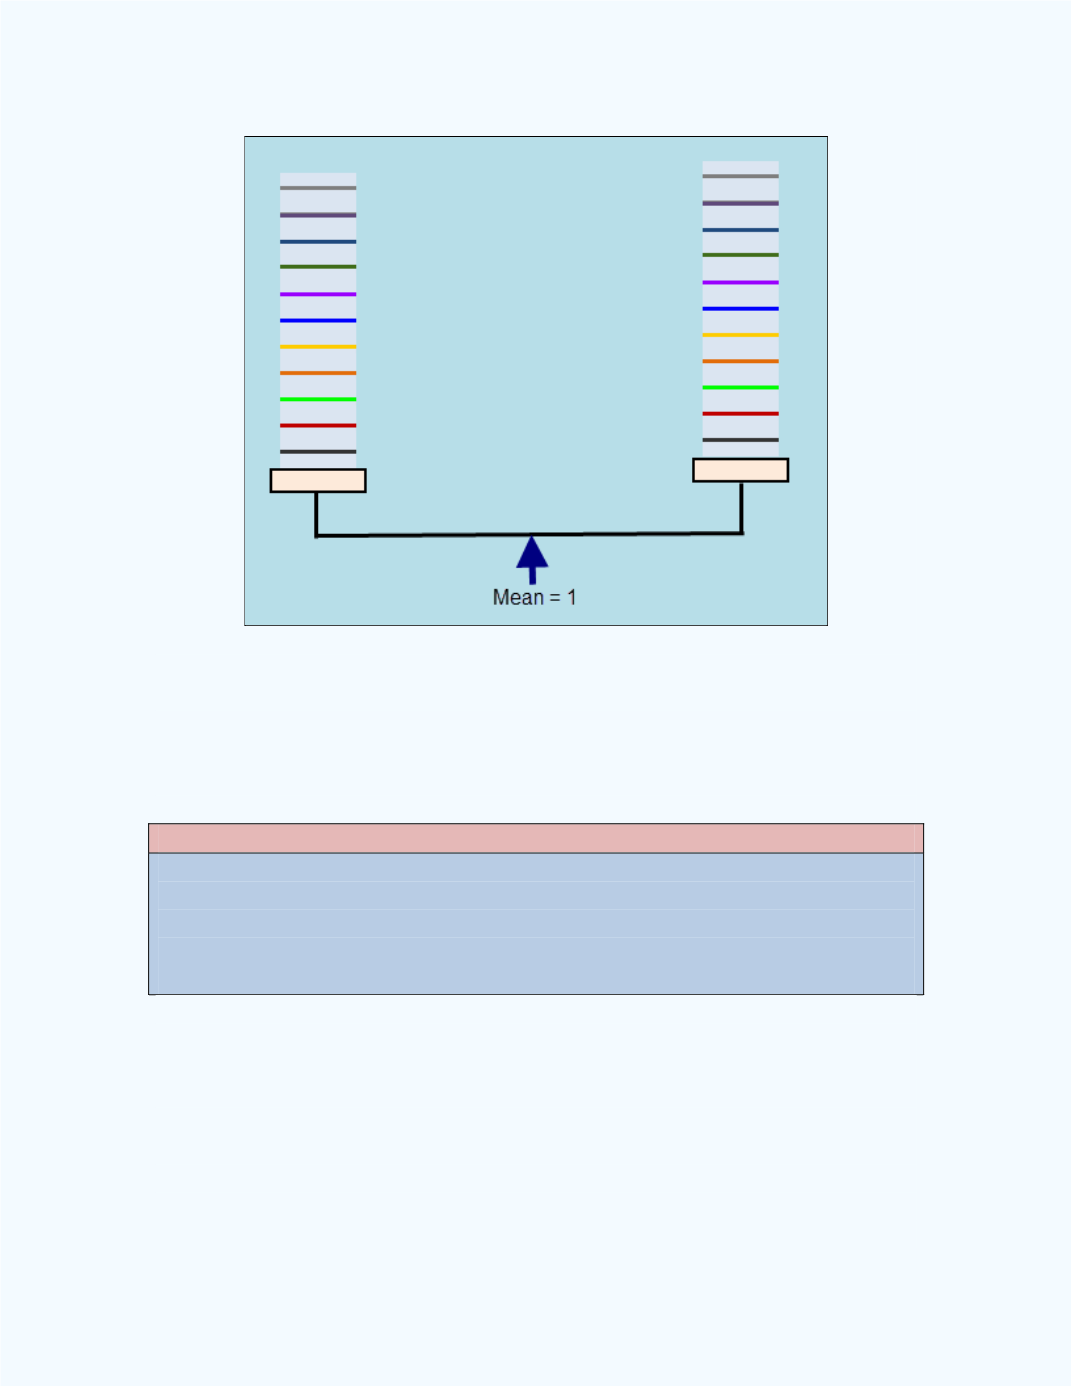
Figure 2-5:
Balanced deviations
From
Figure 2-5
, observe that the balancing point for the deviations is the
mean value of 1. Thus, we can see that the mean can be used as a measure
of central tendency.
Note:
The mean is that central point where the sum of the negative deviations
(absolute value) from the mean and the sum of the positive deviations from
the mean are equal.
The mean as a measure of central tendency, has one drawback. Since the
mean, both for samples and populations, uses all the values in the data set in
the computation, if one or two of these values are very large or very small
relative to the rest of the data set, the mean might not be the appropriate
value to use as a measure of central tendency. For such situations, the mean
will over estimate or under estimate where the center of the data set is
located.