


 58 / 762

58
Chapter 1: Introduction and Graphical Displays
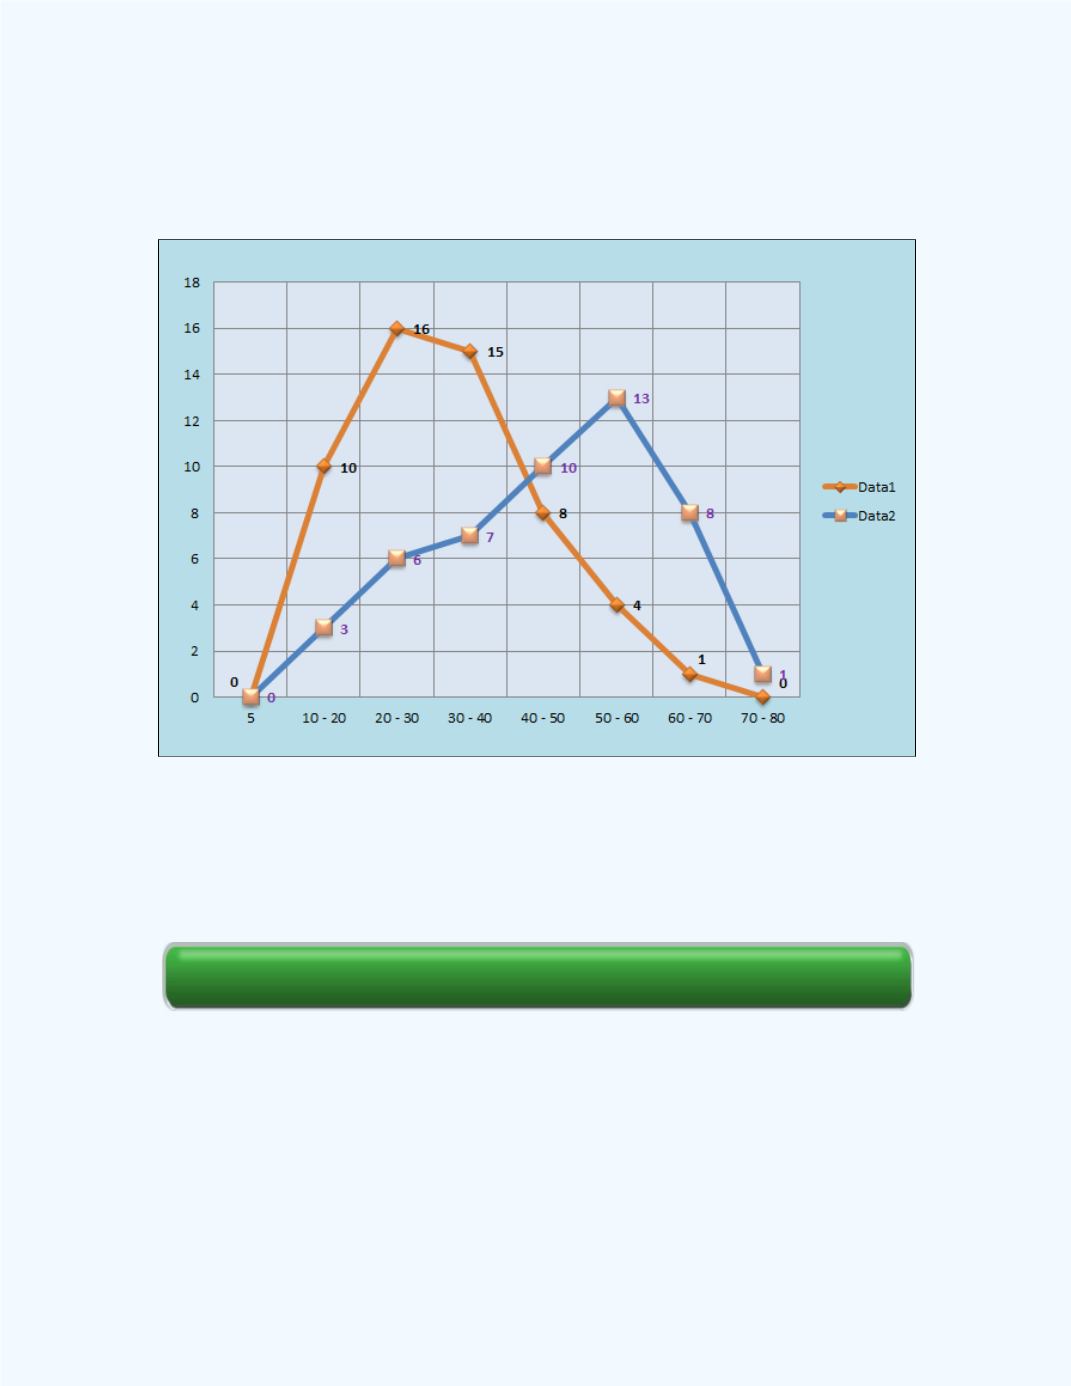
An example of a time plot for grouped data is shown in
Figure 1-28.
We
can use the
Time Series Plot for Grouped Data
workbook to create such
graphs.
Figure 1-28:
Time series plot for grouped data
Section Review
1-10 Pie Graphs or Pie Charts
A pie chart allows us to observe the proportions of sectors relative to the
entire data set. It can be used to display qualitative data as well as
quantitative data. However, categorical or qualitative data readily lend
themselves to this type of graphical display because of the inherent
e-Self Review