


 51 / 762

Chapter 1: Introduction and Graphical Displays
51
Solution:
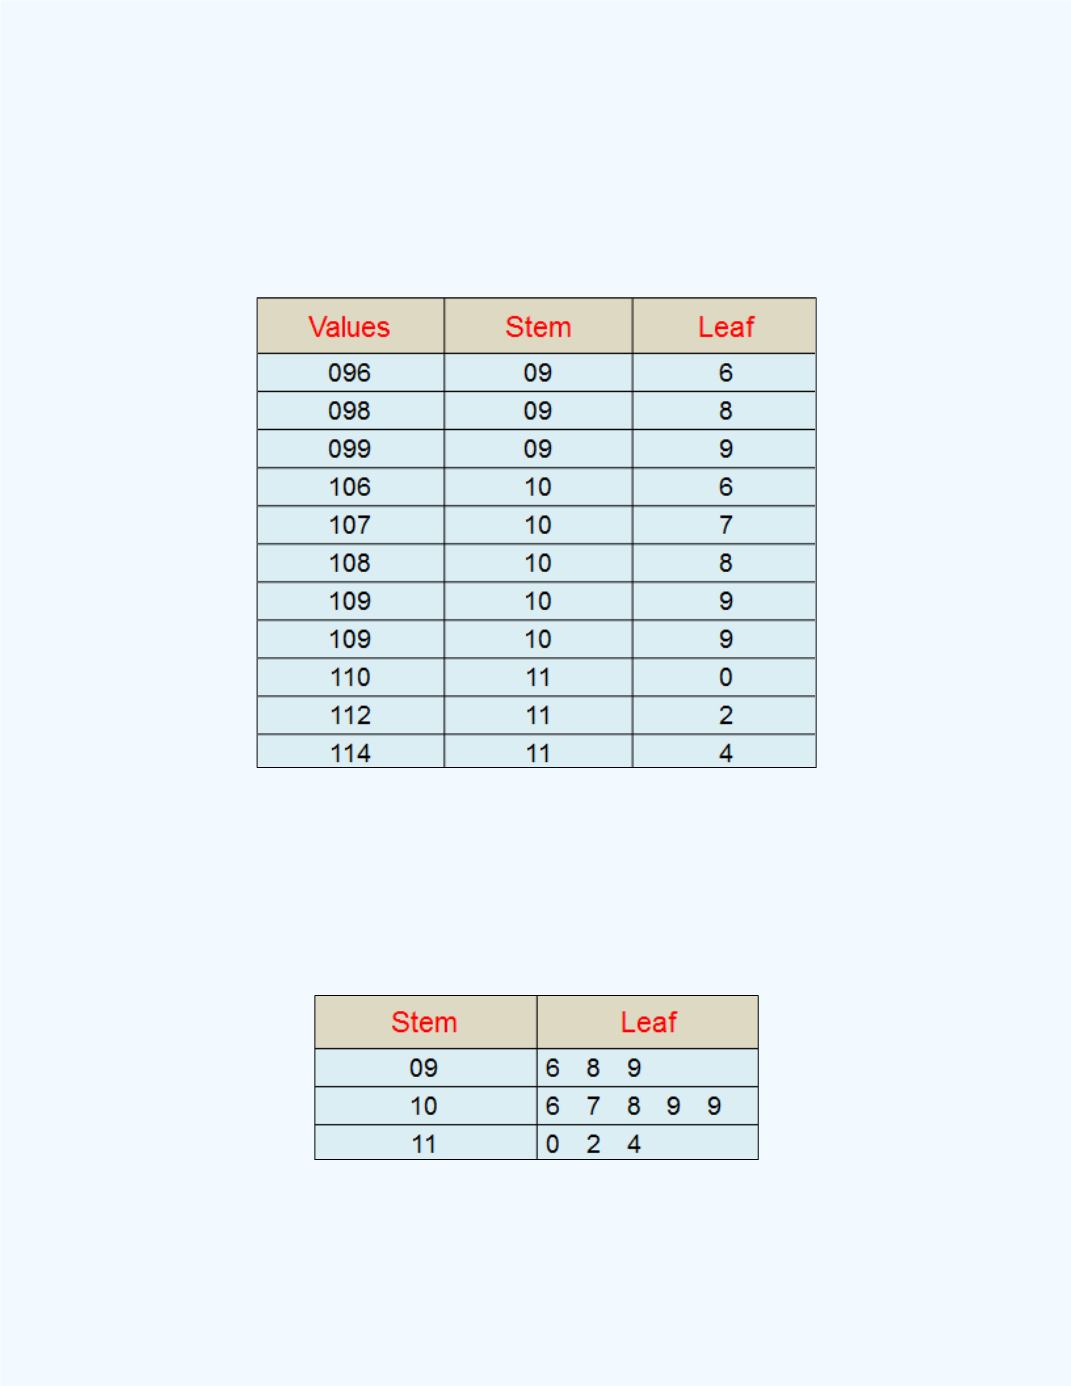
The data, with the stem and leaves are shown in
Table 1-7
.
Table 1-7:
Stems and Leaves for
the Data in
Example 1-10
with the
Unit Digit as the Leaves
We can combine this information to get a stem and leaf plot as shown in
Table 1-8
.
Table 1-8:
Stem-and-Leaf Plot
with the Units Digit as the Leaves
for
Example 1-10