


 48 / 762

48
Chapter 1: Introduction and Graphical Displays
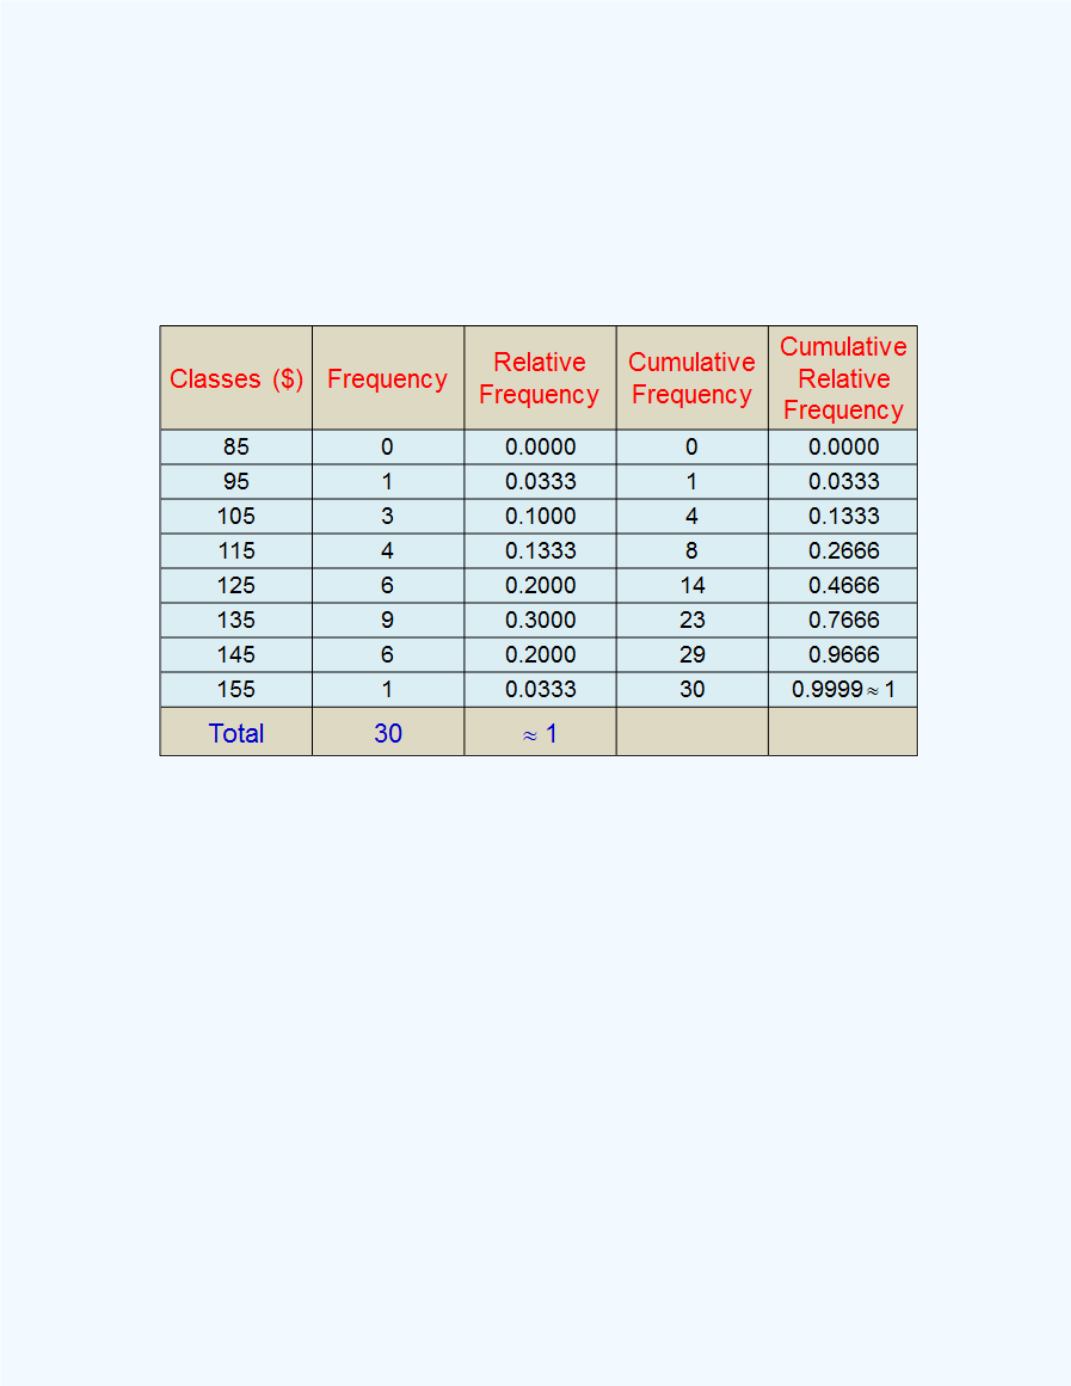
From this table we can extract the necessary information from which to
construct the frequency and relative frequency ogives. The data is given in
the following table. Note that in this case we are starting the table with the
lower limit for the first class with a frequency count of 0. This will allow
the graph to start at 85 and accumulate the frequencies and relative
frequencies from that point to plot for the graph.
The frequency and relative frequency ogives for
Example 1-10
are displayed
in
Figure 1-23
and
1-24
respectively. Observe that they are again similar in
shape. Thus, it does not matter whether the ogives are created from
ungrouped or grouped frequency distributions, the shapes will remain the
same for the same set of data.