


 491 / 762

Chapter 11: Confidence Intervals – Large Samples
491
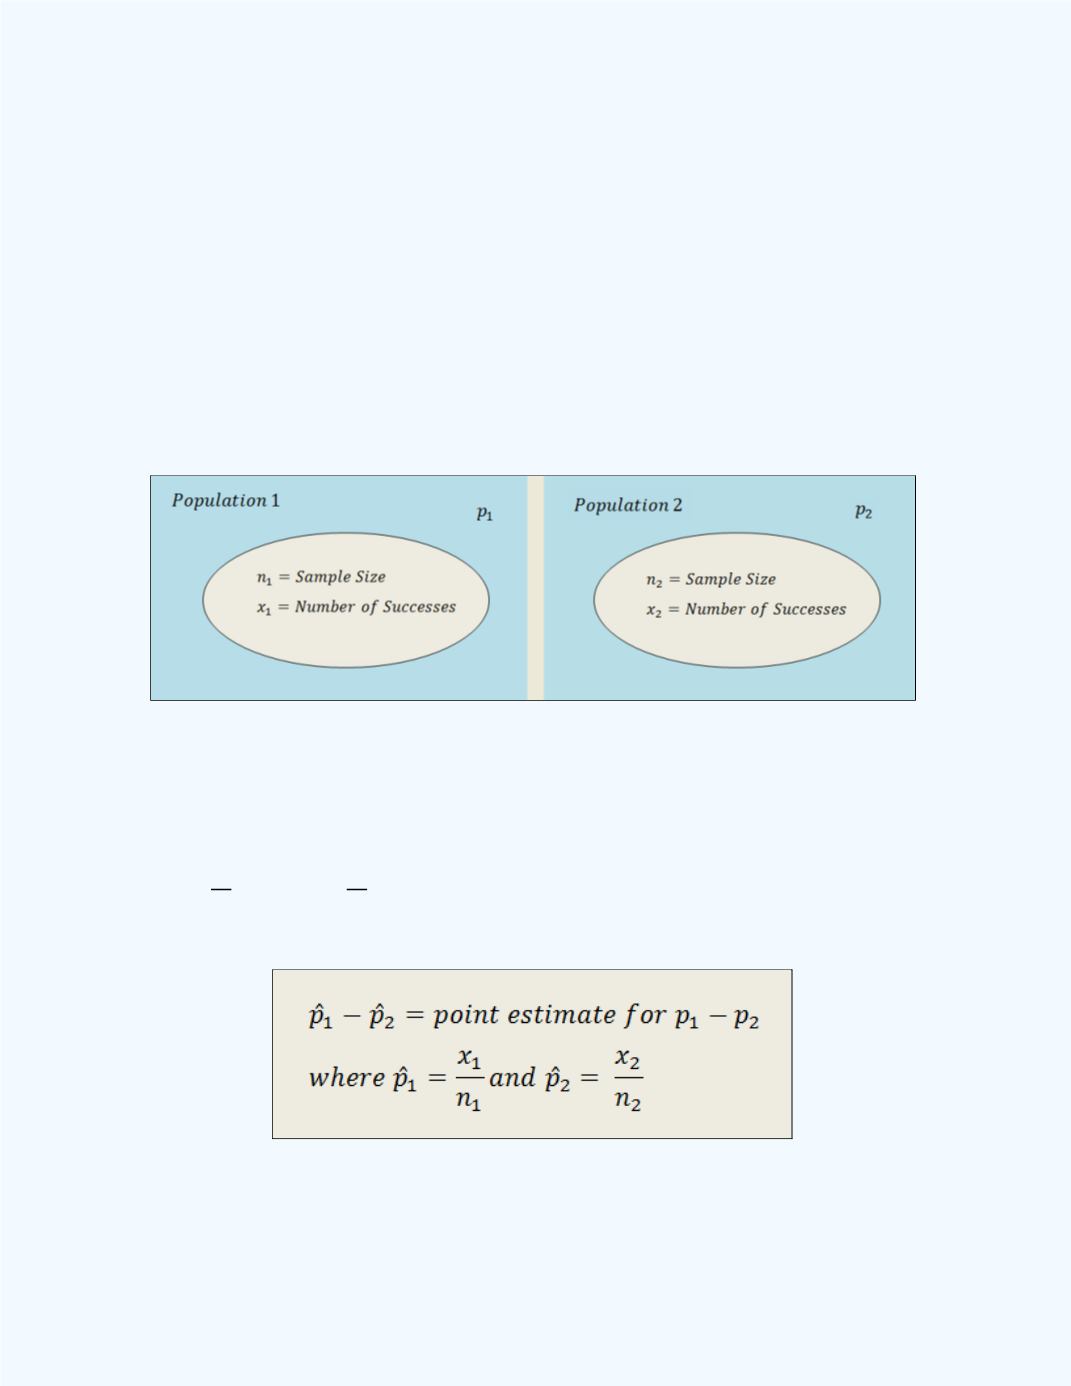
11-4 Large Sample Confidence Interval for the Difference
Between Two Population Proportions
In this section, we will consider estimating the difference between two
population proportions.
Figure 11-14
shows the design of the situation at
hand. We will be sampling from two populations with unknown proportions
for a particular attribute. We will let these population proportions
respectively be denoted by
and
. Samples of size
and
will be
obtained and the number of successes for the particular attribute in each
sample will be recorded. We will let the number of successes be denoted by
and
respectively.
Figure 11-14:
Display of the experimental situation in
selecting samples to estimate the
difference between two population proportions
The point estimate for the population proportions can be computed from
̂
and
̂
and we will consider
̂
̂
as the point estimate for
, the difference between the two population proportions. That is,
From Chapter 10, we can summarize the properties of the sampling
distribution for the difference between two independent sample proportions
with the following statements: