


 493 / 762

Chapter 11: Confidence Intervals – Large Samples
493
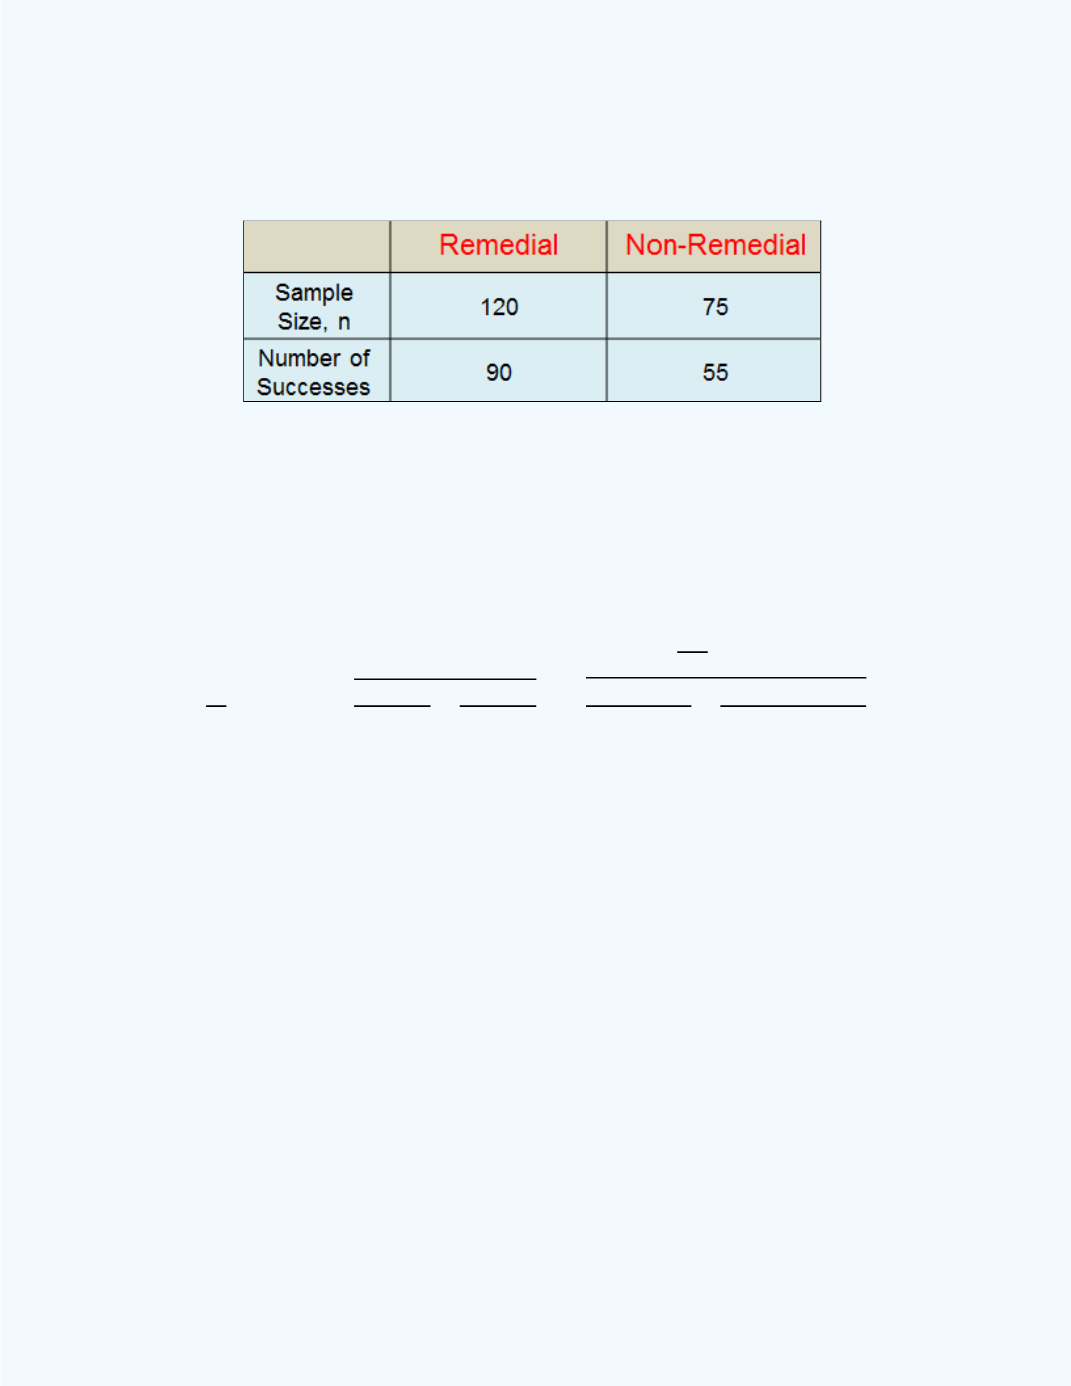
Table 11-1:
Summary information for
Example 11-10
Construct a 95% confidence interval for the difference between the
proportions for the remedial and nonremedial groups.
Solution:
Let
be the proportion of students who were successful from the
remediation group. Let
be the proportion of students who were successful
from the non-remediation group.
From the information given,
= 120,
= 75,
̂
= 0.75,
̂
= 0.7333,
√
̂
̂
̂
̂
√
=
0.0647,
= 0.05,
⁄
= 1.95996
Thus, the 95% confidence interval estimate for the difference of the
proportions is (0.75 – 0.7333)
1.95996
0.0647 = 0.0167
0.12681.
That is, we are 95% confident that the difference between the proportions for
the remedial and non-remedial groups will be between -0.1099 and 0.1433.
However, for all practical purposes, the interval runs from 0 to 0.1433.
Since the lower limit is negative and the upper limit for the interval is
positive, one may conclude that there is not a “significant” difference
between the proportion for the remedial group and the proportion for the non-
remedial group. That is, for the college algebra course, we can conclude that
remediation did not seem to help the students do better than those students
who did not obtain remediation.
We can use the
Large Sample Confidence Interval for the Difference
Between Two Population Proportions
workbook to help with the
computations.
Figure 11 – 15
shows the workbook output.