


 494 / 762

494
Chapter 11: Confidence Intervals – Large Samples
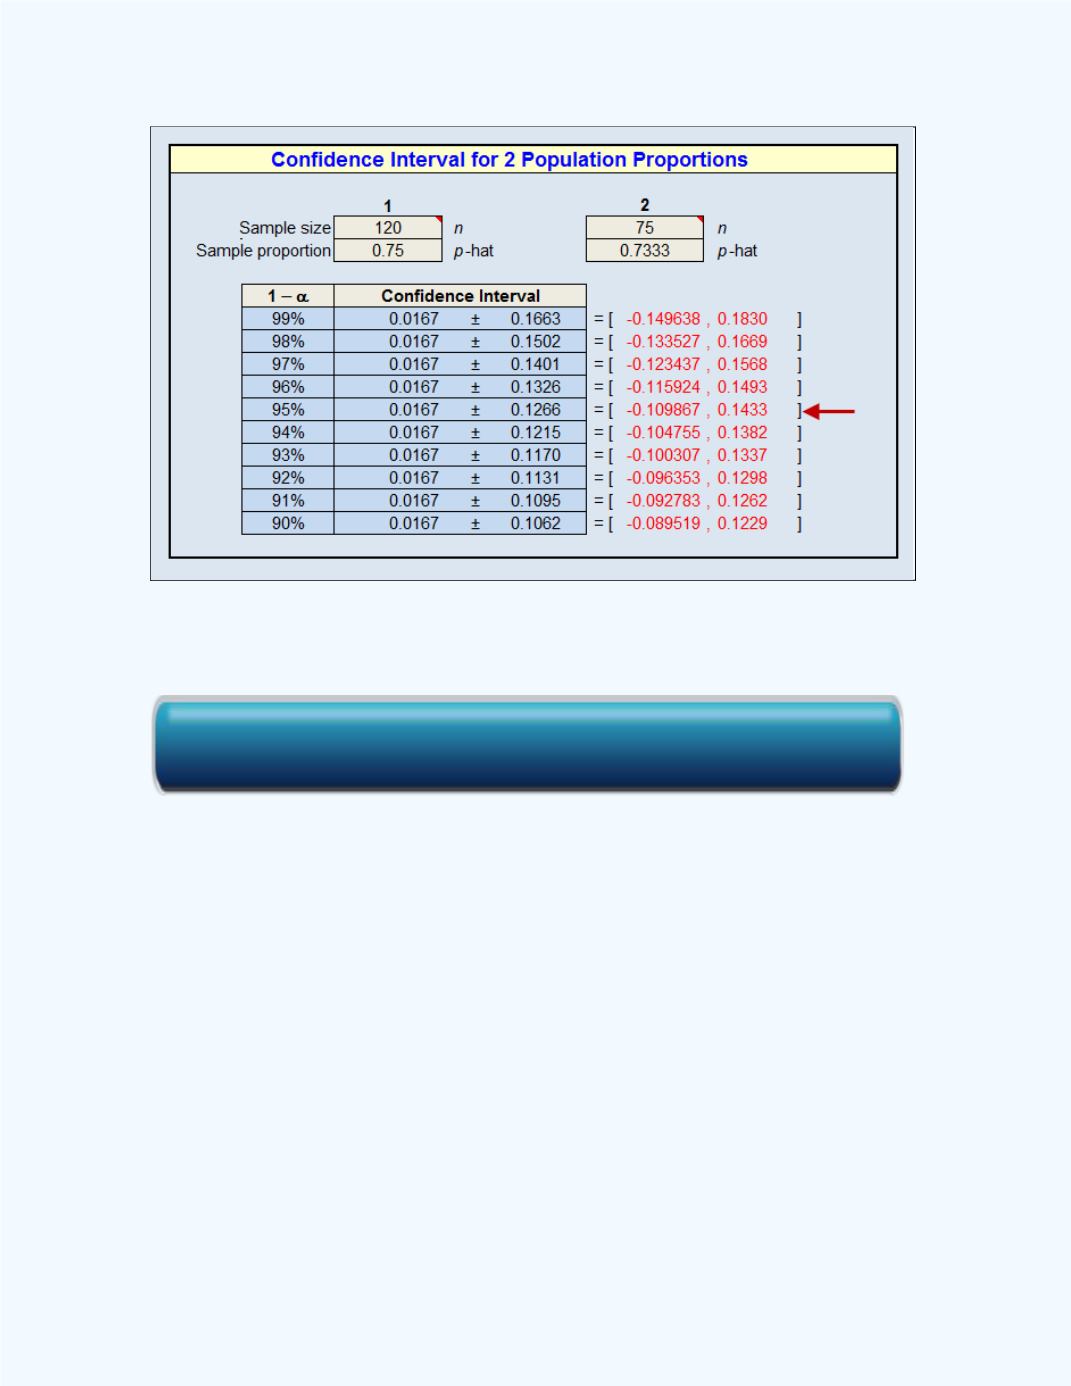
Figure 11- 15:
Workbook Output with the Confidence
Interval for
Example 11-10
The display shows the 95% confidence interval is -0.1099 to 0.1433, the
same as was obtained by using the formula (to four decimal places).
Example 11-11:
Another study was conducted to determine whether
remediation in basic mathematics enabled students, who did not have the
necessary ACT requirements, to be more successful in a basic statistics
course. Success here means a student received a grade of C or better in the
statistics course and remediation was for one-year prior to the statistics
course.
Table 11-2
shows the results of the study.
Click here for the Large Sample Confidence Interval for the Difference Between Two Population Proportions Workbook