


 492 / 762

492
Chapter 11: Confidence Intervals – Large Samples
As the sample sizes
and
increase, the shape of the distribution of
the differences of the sample proportions obtained from any population
(distribution) will approach a normal distribution.
The distribution of the differences of the sample proportions will have a
mean given by
̂
̂
.
The distribution of the differences of the sample proportions will have a
standard deviation given by
̂
̂
√
, where
and
are the respective population proportions of interest.
These properties can aid us in the construction of a (1 -
)
100 percent
confidence interval for the difference of two population proportions. Again,
since we do not know the values of the true proportions, we will use the
corresponding point estimates for these true proportions.
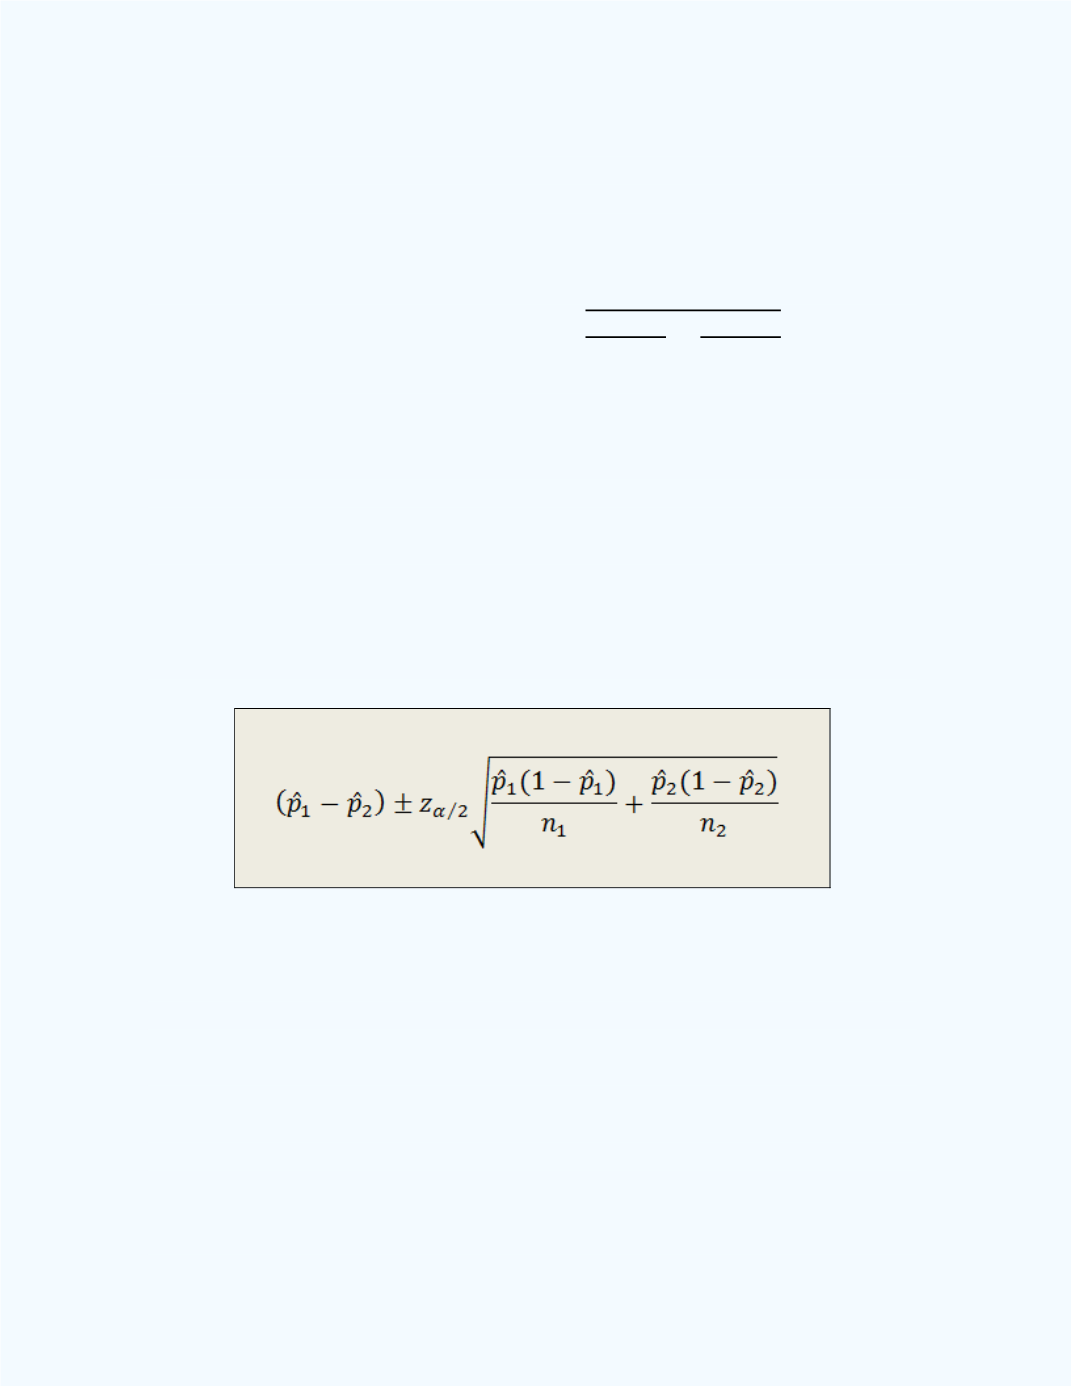
The general equation used in constructing a (1 -
)
100 percent confidence
interval for the difference between two population proportions for large
samples, that is when
5,
5, and
5, is given next.
Example 11-10:
A study was conducted to determine whether remediation
in basic mathematics enabled students, who did not have the necessary ACT
requirements, to be more successful in a college algebra course. Success here
means a student received a grade of C or better in the college algebra course
and remediation was for one-year prior to the college algebra course.
Table
11-1
shows the results of the study.